Surface Addition

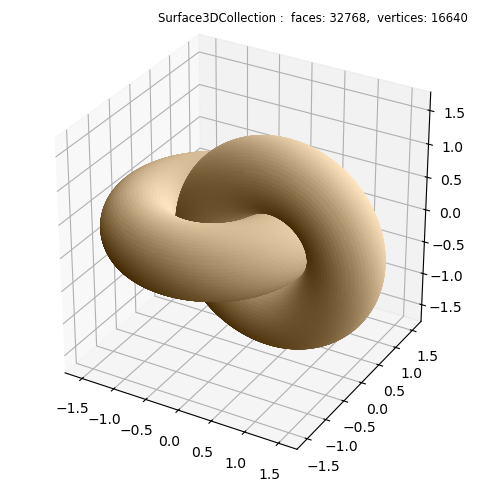
Composite surfaces are constructed by simply adding surface objects together to create a single object, which is then added to the axis.
 1 import numpy as np
 2 from matplotlib import pyplot as plt
 3 import s3dlib.surface as s3d
 4 import s3dlib.cmap_utilities as cmu
 5
 6 #.. Surface Addition
 7
 8 # 1. Define function to examine .....................................
 9
10 def torusFunc(rtz) :
11     # surface geometry f(V) -> V
12     r,t,z = rtz
13     ratio = .5
14     Z = ratio*np.sin(z*np.pi)
15     R = r + ratio*np.cos(z*np.pi)
16     return R,t,Z
17
18 # 2. Setup and map surfaces .........................................
19 rez = 5
20 offset = 0.5
21 posOff, negOff = [offset,0,0], [-offset,0,0]
22 cmu.rgb_cmap_gradient( [0.25,0.15,0], [1,.9,.75], 'cardboard' )
23
24 torus_Z = s3d.CylindricalSurface(rez,basetype='squ' )
25 torus_Z.map_geom_from_op(torusFunc)
26 torus_Z.transform(translate=negOff)
27
28 torus_X = s3d.CylindricalSurface(rez,basetype='squ' )
29 torus_X.map_geom_from_op(torusFunc)
30 torus_X.transform(translate=posOff, rotate=s3d.eulerRot(0,90))
31
32 links = torus_X + torus_Z
33 links.map_cmap_from_normals(direction=[1,1,1], cmap='cardboard')
34
35 # 3. Construct figure, add surfaces, and plot ......................
36 fig = plt.figure(figsize=plt.figaspect(1))
37 fig.text(0.975,0.975,str(links), ha='right', va='top', fontsize='smaller', multialignment='right')
38 ax = fig.add_subplot(111, projection='3d', aspect='equal')
39 minmax = (-1.7,1.7)
40 ax.set(xlim=minmax, ylim=minmax, zlim=minmax)
41
42 ax.add_collection3d(links)
43
44 fig.tight_layout()
45 plt.show()
Warning
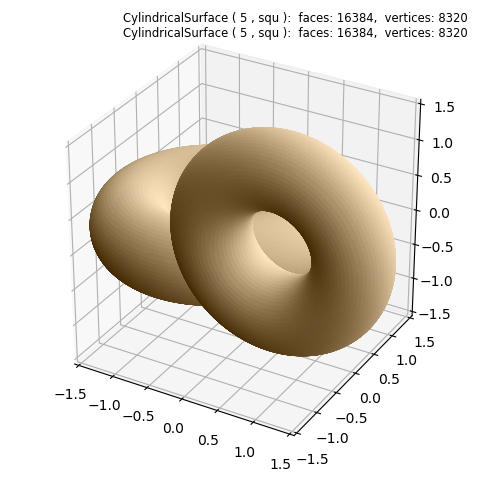
Individual surface objects may be added to the axis, however the z-order is not preserved among the face polygons of the different objects. The average z-order of face polygons of each object is used as a reference to position the individual polygon faces, not referenced to other object polygon faces. The effect of adding the individual objects to the axis instead of the composite is exemplified in the figure below.

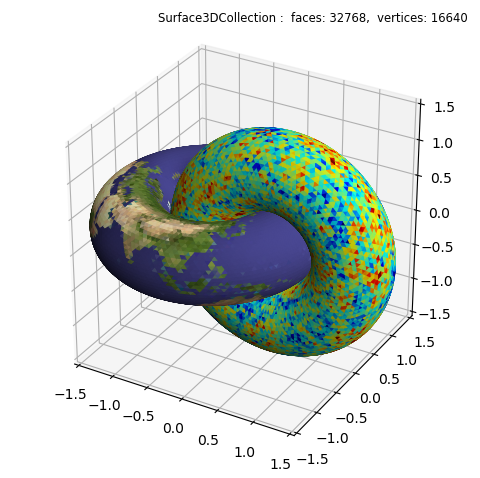
Addition will preserve the colors of the individual objects. For example, including after line 24
torus_Z.map_color_from_image('data/earth.png')
and after line 28
torus_X.map_color_from_image("data/wmap.png")
produces the following figure:

