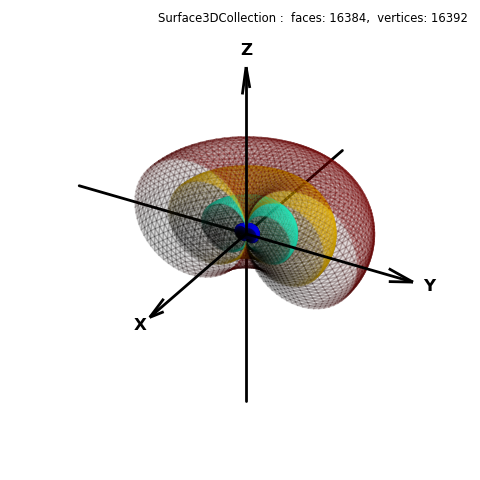
import numpy as np
from matplotlib import pyplot as plt
import s3dlib.surface as s3d
import s3dlib.cmap_utilities as cmu

#.. Parametric Set of Surfaces

# 1. Define functions to examine ....................................
Rmin = 0.05

# pick either for demo ........
def dipoleFunc_1(rtp,Rmax):
    r,t,p = rtp
    delta = Rmax - Rmin
    Z = Rmin + delta*np.sin(p)
    return Z,t,p

def dipoleFunc_2(rtp, Rmax):
    r, theta, phi = rtp
    z = np.abs(Rmax*np.cos(phi))
    return z,theta,phi

# 2. Setup and map surfaces .........................................
rez = 5
lightDirection = [0,1,1]
Rmax = [1.0, 0.7, 0.4, 0.1]
cm_colorMap = cmu.alpha_cmap('jet', 0.15)

dipole = None
for i in range(len(Rmax)) :
    color = cm_colorMap(Rmax[i])
    dp = s3d.SphericalSurface(rez, basetype='octa', facecolor = color )
    dp.map_geom_from_op( lambda rtp : dipoleFunc_1(rtp,Rmax[i])  )
    #dp.map_geom_from_op( lambda rtp : dipoleFunc_2(rtp,Rmax[i])  )
    dp.clip( lambda xyz : xyz[0]<0 , usexyz=True )
    dp.shade(direction=lightDirection)
    if i==0 : dipole = dp
    else:     dipole += dp

# 3. Construct figures, add surfaces, and plot ......................

fig = plt.figure(figsize=plt.figaspect(1) )
fig.text(0.975,0.975,str(dipole), ha='right', va='top', fontsize='smaller', multialignment='right')
ax = plt.axes(projection='3d', aspect='equal')
s3d.standardAxis(ax, negaxis=True, alr=0.15)

ax.add_collection3d(dipole)

fig.tight_layout()
plt.show()

