import numpy as np
import matplotlib.pyplot as plt
import s3dlib.surface as s3d
#.. Function XY uniform colored surface contours.
# 1. Define function to examine ....................................
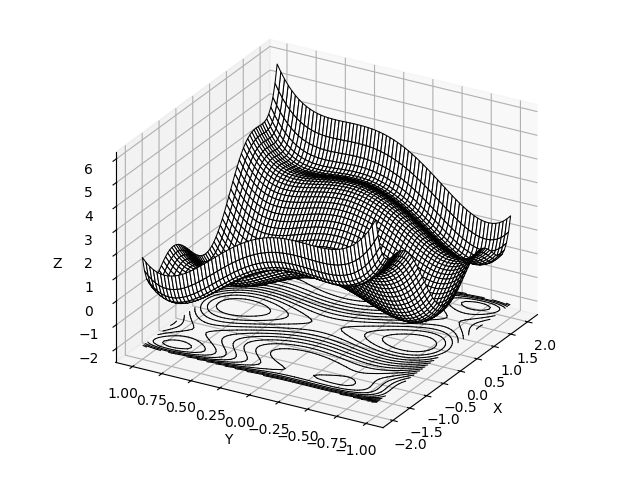
def sixHump(xyz) :
x,y,z = xyz
A = ( 4 - 2.1*x**2 + x**4/3 )*x**2
B = ( -4 + 4*y**2)*y**2
return x, y, (A + x*y + B)
# 2. Setup and map surface .........................................
rez,offset = 5, -2
plane = s3d.PlanarSurface(rez,'squ',color='w',edgecolor='k',lw=.75).domain( 2, 1 )
plane.map_geom_from_op(sixHump)
contours = plane.contourLineSet(20,color='k') # default: planar, z-direction
contours.map_to_plane(offset) # default: planar, z-direction
contours.set_linewidth(.75)
# 3. Construct figure, add surface plot ............................
fig = plt.figure()
ax = plt.axes(projection='3d', proj_type='ortho')
ax.set( xlabel='X', ylabel='Y', zlabel='Z')
ax.view_init(25,-150)
s3d.auto_scale(ax,plane,contours)
ax.add_collection3d(plane)
ax.add_collection3d(contours)
fig.tight_layout(pad=0)
plt.show()