Stanford Bunny

View of the Stanford Bunny test model using an obj format file with Matplotlib rendering.
import matplotlib.pyplot as plt
import s3dlib.surface as s3d

# Stanford Bunny Obj datafile

# Setup surface ................................................

surface = s3d.get_surfgeom_from_obj("data/bunny.obj", color='w',edgecolor='k',lw=.25)

# Construct figure, add surface, plot ..........................

fig = plt.figure(figsize=plt.figaspect(1))
fig.text(0.975,0.975,str(surface), ha='right', va='top', fontsize='smaller', multialignment='right')
ax = plt.axes(projection='3d', aspect='equal')
ax.set( xlabel='X', ylabel='Y', zlabel='Z' )

s3d.auto_scale(ax,surface,uscale=.8)
ax.add_collection3d(surface)

fig.tight_layout(pad=2)

plt.show()
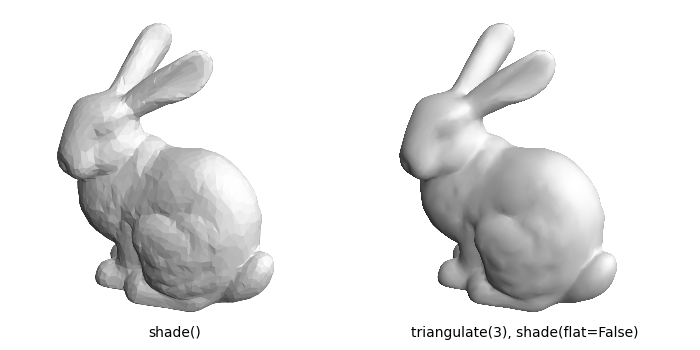
The surface visualization may be smoothed using the object triangulate method and shading as shown below:

import matplotlib.pyplot as plt
import s3dlib.surface as s3d

# Construct figure, add surface, plot ..........................
fig = plt.figure(figsize=(7,3.5))
fig.text(0.25,0.03,'shade()',ha='center',va='bottom')
fig.text(0.75,0.03,'triangulate(3), shade(flat=False)',ha='center',va='bottom')
for i in range(2) :
    ax =fig.add_subplot(121+i, projection='3d', aspect='equal')
    ax.set_axis_off()

    surface = s3d.get_surfgeom_from_obj("data/bunny.obj",color='.9')
    if i==0 : surface.shade().hilite()
    else :    surface.triangulate(3).shade(flat=False).hilite(flat=False)

    s3d.auto_scale(ax,surface,uscale=.75)
    ax.add_collection3d(surface)

fig.tight_layout()
plt.show()
