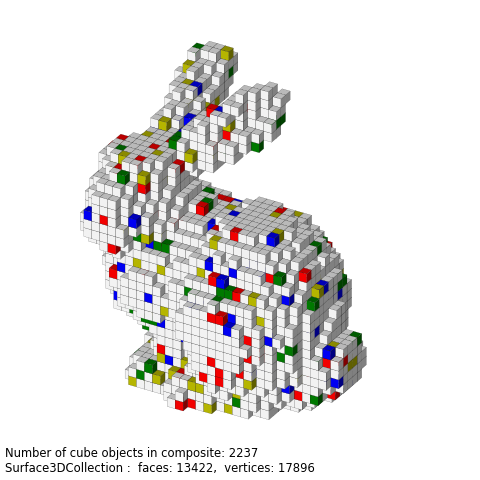
Bunny Blocks

Use of the Stanford Bunny obj format file. Cube coordinates are taken from the surface face coordinates. The algorithm ( block_surface function ) to produce the cubed visualization could be used with any surface object. This surface object was the most interesting. The surface object was clipped to reduce half of the faces which need not be rendered (highlighted line in the script).
REOM: 2
import random
import numpy as np
import matplotlib.pyplot as plt
import s3dlib.surface as s3d

# Toy Bunny from Obj datafile

# 1. Define function to examine .....................................

def block_surface(surf,N=10) :
    bnds = surf.bounds
    ofst = np.array([ bnds['xlim'][0], bnds['ylim'][0],bnds['zlim'][0] ])
    rang = np.array([
        bnds['xlim'][1]- bnds['xlim'][0],
        bnds['ylim'][1]- bnds['ylim'][0],
        bnds['zlim'][1]- bnds['zlim'][0]
      ])
    scale = N/ np.amax(rang)
    fc = np.array(surf.facecenters).T
    fc = (fc-ofst)*scale
    coor = fc.astype(int)
    coor,cInx = np.unique(coor, return_index=True, axis=0)
    return coor.astype(float), cInx

def getRandColors(N):
    random.seed(314)
    c = ['w', 'r', 'g', 'b', 'y']
    sample = [0]*23 + [1,2,3,4]
    return [ c[ random.choice(sample) ]  for i in range(0,N) ]

# 2. Setup and map surfaces .........................................

surface = s3d.get_surfgeom_from_obj("data/bunny.obj", color='w',edgecolor='k',lw=.25)
cubeCenters,tmp = block_surface(surface,30)

unitCubes = None
cArr = getRandColors(len(cubeCenters) )
for i,pos in enumerate( cubeCenters ) :
    cube = s3d.CubicSurface(0,color=cArr[i])
    cube.transform(scale=0.5,translate=pos)
    if unitCubes is None : unitCubes = cube
    else : unitCubes += cube
info = 'Number of cube objects in composite: '+str(len(cubeCenters))+'\n'+str(unitCubes)
unitCubes.clip_normals()
unitCubes.shade(direction= (0,-1,0.5) )
unitCubes.set_edgecolor('k')
unitCubes.set_linewidth(0.1)

# 3. Construct figure, add surface, plot ............................

fig = plt.figure(figsize=plt.figaspect(1))
fig.text(0.01,0.01,info, ha='left', va='bottom', fontsize='smaller')
ax = plt.axes(projection='3d', aspect='equal')
ax.set_axis_off()
ax.set( xlabel='X', ylabel='Y', zlabel='Z' )
ax.set_proj_type('ortho')
s3d.auto_scale(ax,unitCubes,uscale=.9)
ax.add_collection3d(unitCubes)
fig.tight_layout(pad=0)

plt.show()
