
Swiss Roll Surface
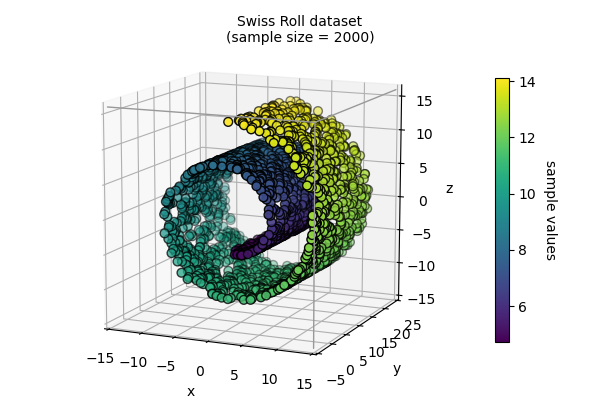
This example is based on the scikit-learn Swiss Roll dataset which is illustrated below:
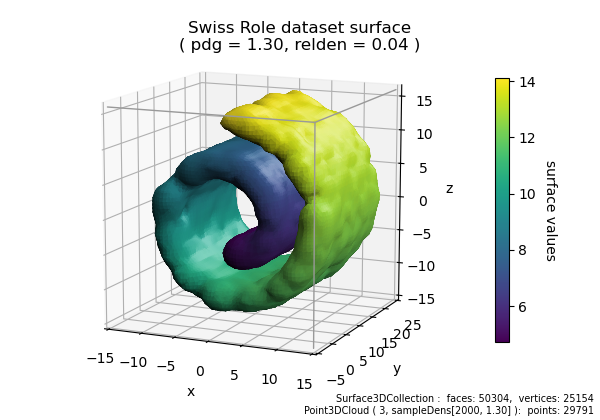
In this example, the surface vertex values are assigned from the sample dataset using the map_vertvals_from_samples surface object method. The surface is then colormapped using these vertex values, as shown highlighted below.
import numpy as np
import matplotlib.pyplot as plt
import s3dlib.surface as s3d
import s3dlib.pntcloud as ptc

from sklearn import datasets

# 1. Get data to examine ...........................................
npnts,seed,domain = 2000, 6, [ [-15,15], [-5,25], [-15,16] ]
sr_points, sr_color = datasets.make_swiss_roll(n_samples=npnts, random_state=seed)
data = np.column_stack((sr_points, sr_color))

# 2. Setup surface ................................................
pdg, drez, relden = 1.3 , 3,  0.04

cloudObj = ptc.Point3DCloud(drez,domain=domain)

#... define surface from point cloud of sample density ...
cloudObj.map_vals_from_sampdens(data,pdg)
surface = cloudObj.valsurf(relden,name='swiss roll')

surface.map_vertvals_from_samples(data,domain)
surface.map_cmap_from_vertvals('viridis')
surface.triangulate(1)

# 3. Construct figures, add surfaces, and plot ....................
fig = plt.figure(figsize=(6,4.2))
fig.text(.99,.01,str(surface)+'\n'+str(cloudObj),va='bottom',ha='right',fontsize='x-small')
title = 'Swiss Role dataset surface\n( pdg = {:.2f}, relden = {:.2f} )'.format(pdg,relden)
fig.text(0.5,0.95,title,va='top',ha='center',fontsize='large')
ax = plt.axes(projection='3d', aspect='equal')
ax.set(xlim=domain[0], ylim=domain[1], zlim=domain[2],
    xlabel='x',ylabel='y',zlabel='z')
ax.view_init(azim=-66, elev=12)

ax.add_collection3d(surface.shade(flat=False).hilite(.5,focus=2,flat=False))
s3d.add_boxCorner(ax,domain)

scmp = surface.cBar_ScalarMappable
cbar = plt.colorbar(scmp, ax=ax,  shrink=0.7, pad=.1 )
cbar.set_label('surface values', rotation=270, labelpad=15)

fig.tight_layout(pad=1.5)
plt.show()