import numpy as np
from matplotlib import pyplot as plt
import s3dlib.surface as s3d
#.. Polar and Cylindrical Datagrid Mapping
# 1. Define function to examine .....................................
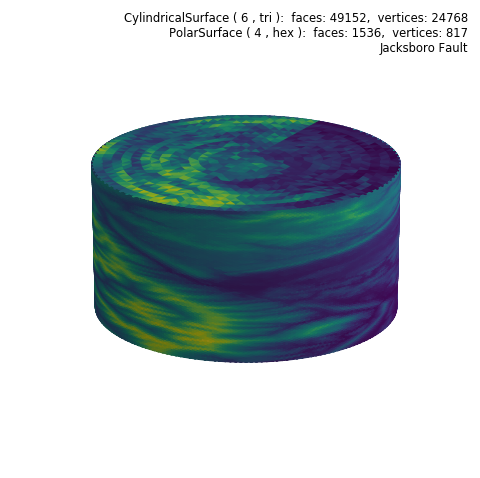
Z=np.load('data/jacksboro_fault_dem.npz')['elevation']
datagrid = np.flip(Z,0)
# 2. Setup and map surfaces .........................................
rez=6
side_can = s3d.CylindricalSurface(rez)
side_can.map_cmap_from_datagrid(datagrid)
top_can = s3d.PolarSurface(rez-2)
top_can.map_cmap_from_datagrid(datagrid)
top_can.transform(translate=[0,0,1])
can = (side_can + top_can).transform(scale=[1,1,.5]).shade(0.5,direction=[1,-.5,0])
# 3. Construct figure, add surfaces, and plot ......................
fig = plt.figure(figsize=plt.figaspect(1) )
info = str(side_can) + '\n' + str(top_can) + '\nJacksboro Fault'
fig.text(0.975,0.975,info, ha='right', va='top', fontsize='smaller', multialignment='right')
ax = fig.add_subplot(111, projection='3d', aspect='equal')
minmax = (-0.8,0.8)
ax.set(xlim=minmax, ylim=minmax, zlim=minmax)
ax.set_axis_off()
ax.view_init(20,210)
ax.add_collection3d(can)
fig.tight_layout()
plt.show()