import numpy as np
import matplotlib.pyplot as plt
import s3dlib.surface as s3d
#.. Geometric and Color Datagrid Line Filled Surface
# 1. Define function to examine .....................................
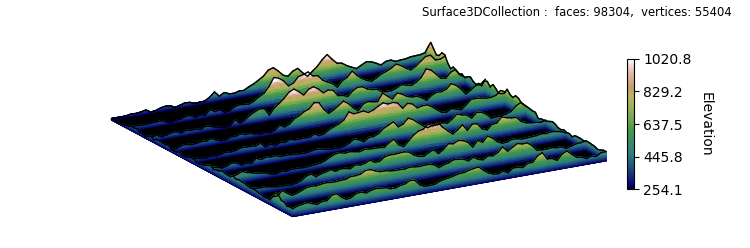
Z=np.load('data/jacksboro_fault_dem.npz')['elevation']
datagrid = np.flip(Z,0)
# 2. Setup and map surfaces .........................................
rez=5
line = s3d.ParametricLine(rez, cmap='gist_earth',lw=1)
line.map_xySlice_from_datagrid(datagrid, scale=0.2, xset=2, yset=10)
line.map_cmap_from_datagrid(datagrid,cname='Elevation').shade(0.8)
line.set_color('k')
surface = line.get_filled_surface().triangulate(3)
surface.map_cmap_from_op( lambda xyz : xyz[2],'gist_earth')
# 3. Construct figure, add surface, plot ............................
fig = plt.figure(figsize=(7.5,2.5))
fig.text(0.975,0.975,str(surface), ha='right', va='top',
fontsize='smaller', multialignment='right')
ax = plt.axes(projection='3d')
ax.set(xlim=(-1,1), ylim=(-1,1), zlim=(0,0.25) )
minc, maxc = line.bounds['vlim']
cbar=plt.colorbar(line.cBar_ScalarMappable, ax=ax,
ticks=np.linspace(minc,maxc,5), shrink=0.6, pad=-.08 )
cbar.set_label(line.cname, rotation=270, labelpad = 15)
ax.set_axis_off()
ax.set_proj_type('ortho')
ax.view_init(elev=71, azim=60)
ax.add_collection3d(surface)
ax.add_collection3d(line)
ax.add_collection3d(s3d.PlanarSurface(color='k'))
fig.tight_layout()
plt.show()