
Comparison of Surface Color Methods from clouds
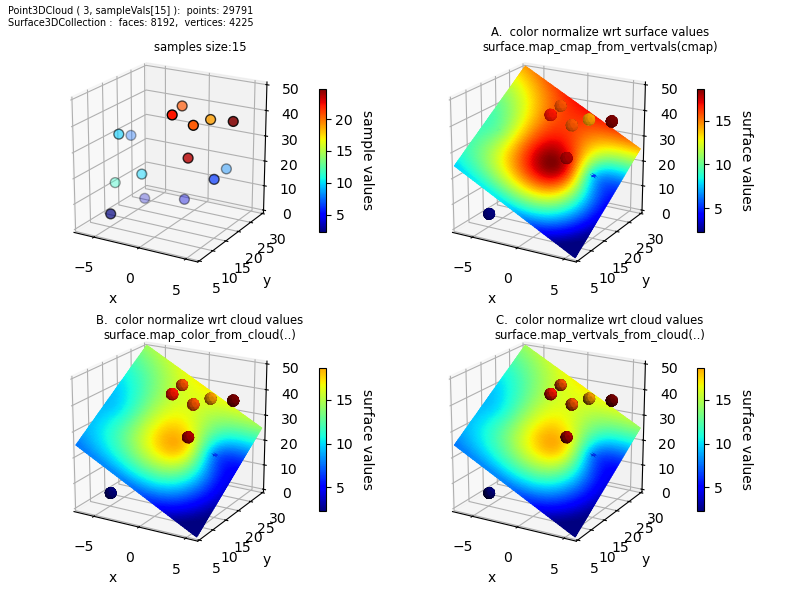
In the above example, sample values are mapped to colors, then the values are mapped to a point cloud (not shown in the figure).
Then there are several methods to apply colormapping from valued samples using the point cloud. A small sample size is used in this example to amplify the effect of these methods:
Values ae transferred to the surface vertices, then the surface is colormapped from the vertex values.
The point cloud is first colormapped from the values. The surface faces are then colored from the cloud.
The point cloud is first colormapped from the values. The surface vertex values are mapped from the cloud. By default, since the cloud is colormapped, the surface uses the values to colormap the faces from the vertices.
For cases B and C, the colorbar reflects the colors for values in the cloud and samples. This is a result that the max/min in surface values does not necessarily reflect the max/min values of the samples. However for these two cases, the surface colors reflect the sample colors for the same values with a subset of the colormap. These mapping methods also apply to function mapped clouds.
import numpy as np
import matplotlib.pyplot as plt
from matplotlib import cm,colors
import s3dlib.surface as s3d
import s3dlib.pntcloud as ptc

# 1. generate data samples with values ............................
N,seed,val_mult,domain = 15, 10, 25, [ [-7,6], [5,30], [0,50] ]
np.random.seed(seed)
xlim,ylim,zlim = domain
xc = np.random.uniform(*xlim, N)
yc = np.random.uniform(*ylim, N)
zc = np.random.uniform(*zlim, N)
dt_coor = np.column_stack((xc,yc,zc))
vals = val_mult*np.random.uniform(size=N)
points = np.column_stack((dt_coor,vals))

xmin,xmax,ymin,ymax,zmin,zmax = np.array(domain).flatten()
zmid = 0.5*(zmin+zmax)
verts = [ [xmax,ymin,zmin], [ xmax,ymax,zmid ], [ xmin,ymax,zmax], [ xmin,ymin,zmid ] ]
faces =[ [0,1,2,3]]

# 2. Setup and map point cloud ....................................
drez,trez,cmap = 3, 6,'jet'

sampleObj = s3d.samples_to_object(points, domain, cmap)

cloudObj = ptc.Point3DCloud(drez,domain=domain)
cloudObj.map_vals_from_sampvals(points, vadj='c')

plane_A = s3d.Surface3DCollection(verts,faces).triangulate(trez)
plane_A.map_vertvals_from_cloud(cloudObj)
plane_A.map_cmap_from_vertvals(cmap)       #.. cmap only referencing surface values

cloudObj.map_cmap_from_cloudvals(cmap)     #.. NOW colormap the cloudObj

plane_B = s3d.Surface3DCollection(verts,faces).triangulate(trez)
plane_B.map_color_from_cloud(cloudObj)     #.. use colormap from cloud

plane_C = s3d.Surface3DCollection(verts,faces).triangulate(trez)
plane_C.map_vertvals_from_cloud(cloudObj)  #.. default colormapped from cloud

# 3. Construct figures, add surfaces, and plot ....................
fig = plt.figure(figsize=(8,6))
title=str(cloudObj)+'\n'+str(plane_A)
fig.text(.01,0.99,title,ha='left',va='top',fontsize='x-small')
# ....................
title = 'samples size:{}'.format(N)
fig.text(.25,0.91,title,ha='center',va='bottom',fontsize='small')
ax = fig.add_subplot(221, projection='3d', aspect='equal')
ax.view_init(20)
ax.set(xlim=xlim, ylim=ylim, zlim=zlim, xlabel='x',ylabel='y')
ax.scatter(*dt_coor.T, s=50, c=vals, cmap=cmap ,edgecolor='k')
norm = colors.Normalize(np.min(vals),np.max(vals) )
cbar =fig.colorbar(cm.ScalarMappable(norm=norm, cmap=cmap), ax=ax,shrink=0.6, pad=.1)
cbar.set_label('sample values', rotation=270, labelpad = 15)

# ....................
title = 'A.  color normalize wrt surface values\nsurface.map_cmap_from_vertvals(cmap)'
fig.text(.75,0.91,title,ha='center',va='bottom',fontsize='small')
ax = fig.add_subplot(222, projection='3d', aspect='equal')
ax.view_init(20)
ax.set(xlim=xlim, ylim=ylim, zlim=zlim, xlabel='x',ylabel='y')
ax.add_collection3d(plane_A+sampleObj.shade(.5,ax=ax))
cbar = plt.colorbar(plane_A.cBar_ScalarMappable, ax=ax,  shrink=0.6, pad=0.1 )
cbar.set_label('surface values', rotation=270, labelpad = 15)

# ....................
title = 'B.  color normalize wrt cloud values\nsurface.map_color_from_cloud(..)'
fig.text(.25,0.43,title,ha='center',va='bottom',fontsize='small')
ax = fig.add_subplot(223, projection='3d', aspect='equal')
ax.view_init(20)
ax.set(xlim=xlim, ylim=ylim, zlim=zlim, xlabel='x',ylabel='y')
ax.add_collection3d(plane_B+sampleObj.shade(.5,ax=ax))
cbar = plt.colorbar(plane_B.cBar_ScalarMappable, ax=ax,  shrink=0.6, pad=0.1 )
cbar.set_label('surface values', rotation=270, labelpad = 15)

# ....................
title = 'C.  color normalize wrt cloud values\nsurface.map_vertvals_from_cloud(..)'
fig.text(.75,0.43,title,ha='center',va='bottom',fontsize='small')
ax = fig.add_subplot(224, projection='3d', aspect='equal')
ax.view_init(20)
ax.set(xlim=xlim, ylim=ylim, zlim=zlim, xlabel='x',ylabel='y')
ax.add_collection3d(plane_C+sampleObj.shade(.5,ax=ax))
cbar = plt.colorbar(plane_C.cBar_ScalarMappable, ax=ax,  shrink=0.6, pad=0.1 )
cbar.set_label('surface values', rotation=270, labelpad = 15)

# ....................
fig.tight_layout(pad=3)
plt.show()