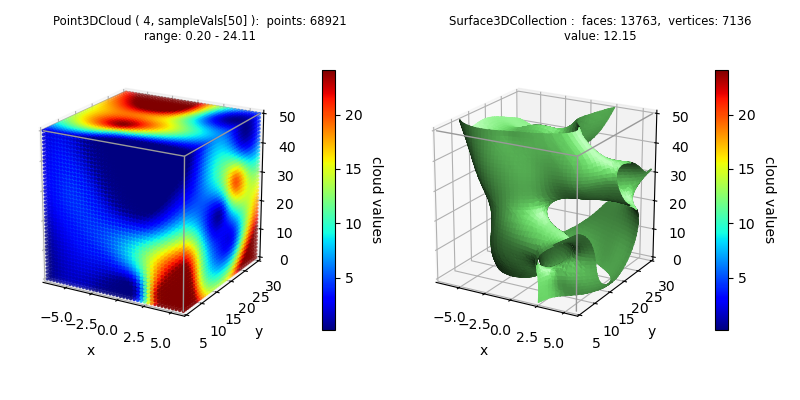
import numpy as np
import matplotlib.pyplot as plt
from matplotlib import cm,colors
import s3dlib.surface as s3d
import s3dlib.pntcloud as ptc

# 1. generate data samples with values ............................
N,seed,val_mult,domain = 50, 6, 25.0, [ [-7,6], [5,30], [0,50] ]
np.random.seed(seed)
xc = np.random.uniform(*domain[0], N)
yc = np.random.uniform(*domain[1], N)
zc = np.random.uniform(*domain[2], N)
dt_coor = np.column_stack((xc,yc,zc))
vals = val_mult*np.random.uniform(size=N)
vmin,vmax,vmid = np.min(vals),np.max(vals), ( np.min(vals) + np.max(vals) )/2
points = np.column_stack((dt_coor,vals))

# 2. Setup and map point cloud ....................................
drez,vadj,cmap = 4, 'c', 'jet'

cloudObj = ptc.Point3DCloud(drez,domain=domain)
cloudObj.map_vals_from_sampvals(points,vadj=vadj, cmap=cmap)
bnd = cloudObj.bounds['vlim']

surface = cloudObj.valsurf( vmid )

# 3. Construct figures, add surfaces, and plot ....................
fig = plt.figure(figsize=(8,4))
# ....................
title = str(cloudObj) +'\nrange: {:.2f} - {:.2f}'.format(bnd[0],bnd[1])
fig.text(0.25,0.9,title, ha='center', fontsize='small')
ax = fig.add_subplot(121, projection='3d', aspect='equal')
ax.view_init(20)
ax.set(xlim=domain[0], ylim=domain[1], zlim=domain[2], xlabel='x',ylabel='y')
cloudObj.add_to3d(ax)
s3d.add_boxCorner(ax,domain)
cbar = plt.colorbar(cloudObj.cBar_ScalarMappable, ax=ax,  shrink=0.7, pad=0.1 )
cbar.set_label('cloud values', rotation=270, labelpad = 15)
# ....................
title = str(surface) +'\nvalue: {:.2f}'.format(vmid)
fig.text(0.75,0.9,title, ha='center', fontsize='small')
ax = fig.add_subplot(122, projection='3d', aspect='equal')
ax.view_init(20)
ax.set(xlim=domain[0], ylim=domain[1], zlim=domain[2], xlabel='x',ylabel='y')
ax.add_collection3d(surface.shade(ax=ax).hilite(.5,ax=ax))
s3d.add_boxCorner(ax,domain)
cbar = plt.colorbar(cloudObj.cBar_ScalarMappable, ax=ax,  shrink=0.7, pad=0.1 )
cbar.set_label('cloud values', rotation=270, labelpad = 15)
# ....................
fig.tight_layout(pad=1)
plt.show()