
Data Sources
The following are the data sources used in the various example plots.


python_elevation.png (1000x1000)
Using the above image, python.png, as the source, created a simple ‘inner glow’ layer style using Photoshop.
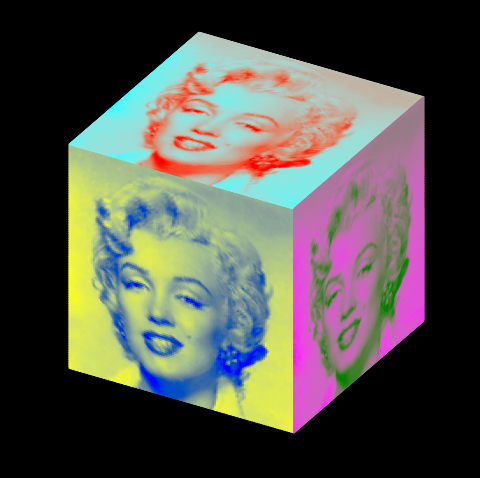
monroe.png (375x375)
This image originated from Wikimedia Commons Monroe . The image was downloaded, resized, level-adjusted and saved as a png format.
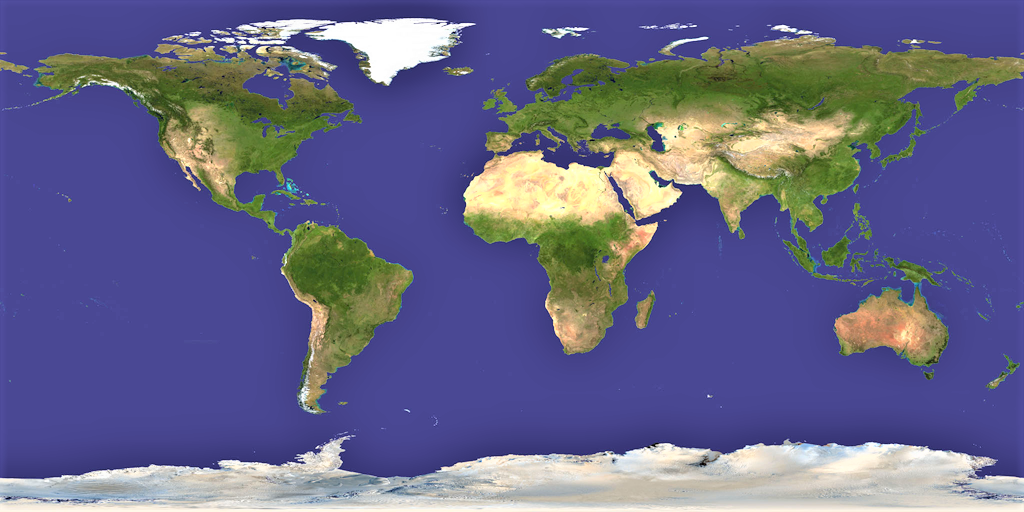
blue_marble.png (1024x512)
This image originated from the Blue Marble Collection from NASA visible earth catalog. The image was downloaded, resized and saved as a png format.
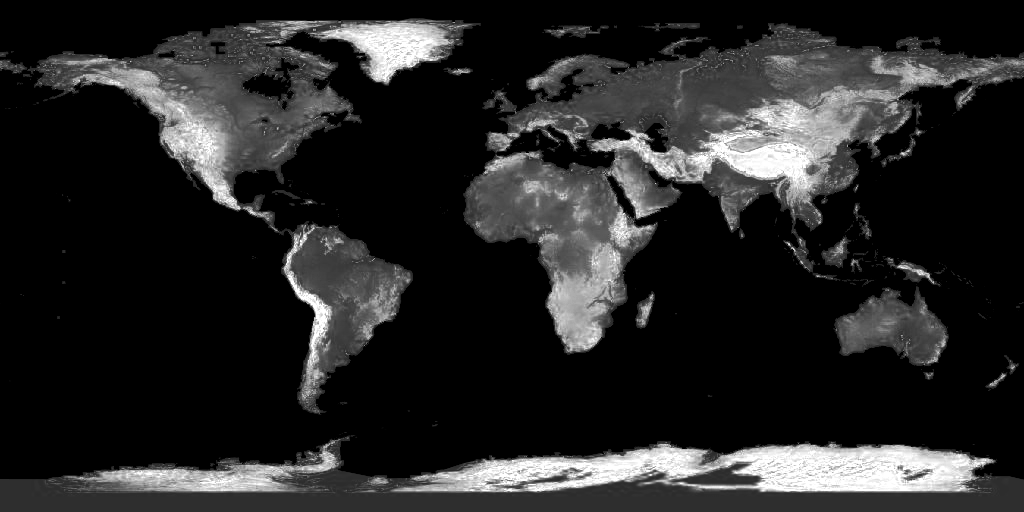
elevation.png (1024x512)
The original image was from the Topography page in the NASA visible earth catalog. Using Photoshop, the image levels were adjusted to increase the contrast. Finally, the image was resized and saved to a png format.
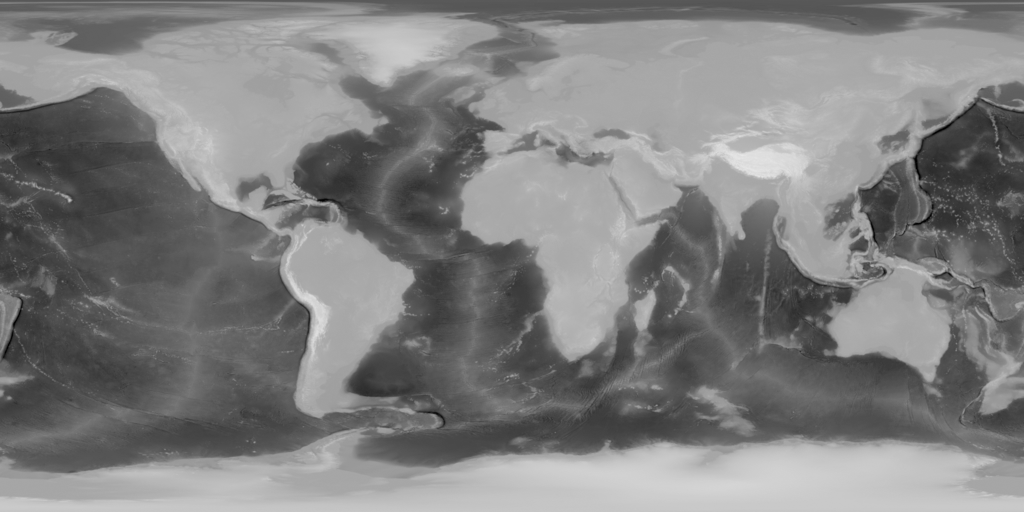
earth_dry_elevation.png (1024x512)
The original image was from the Wikimedia page based on the depthmap of Earth combining topography and bathymetry from NASA Visible Earth. Using Photoshop, the greyscale image was converted to RGB.
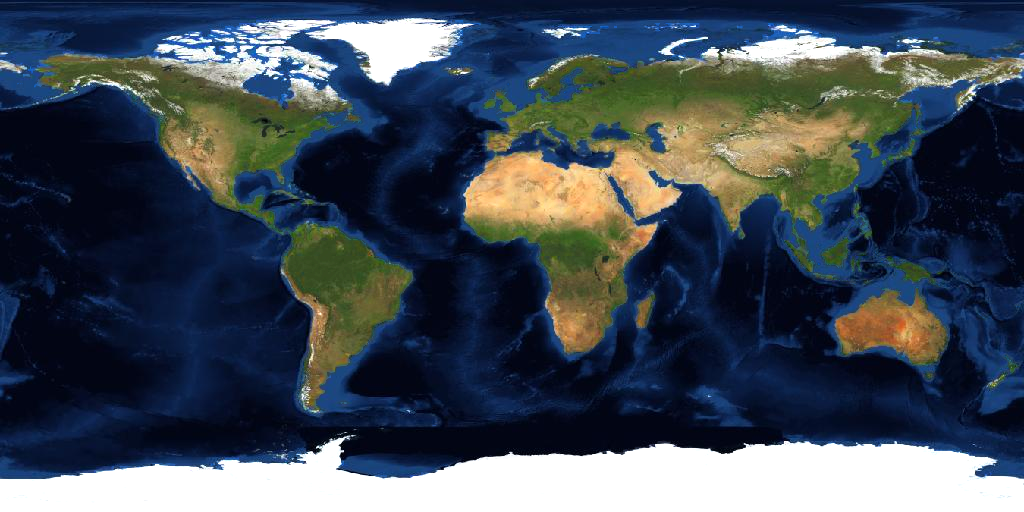
earth.png (1024x512)
The image originated from the Blue Marble: Land Surface Shallow Water, and Shaded Topography page from the NASA visible earth catalog. Using Photoshop, the blue water was lightened and shifted toward cyan. Finally, the image was resized and saved to a png file format.
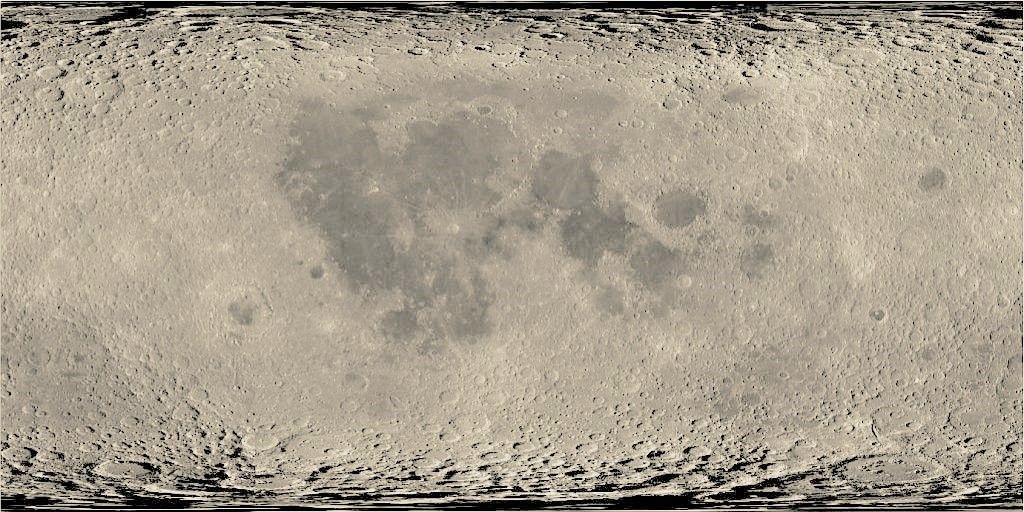
moon.png (1024x512)
The original image was obtained from Moon LRO LROC WAC Global Morphology Mosaic page in USGS and NASA Astropedia catalog. Using Photoshop, the image was colorized and filtered. Finally the image was resized and saved in a png format.
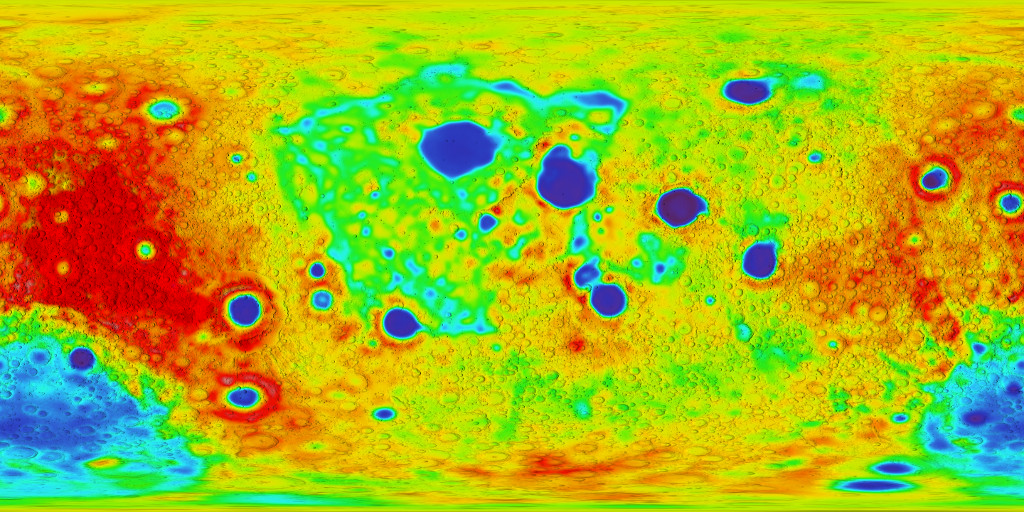
moon_elev.png (1024x512)
The original image was obtained from the GRAIL Primary Mission Gravity Maps page in NASA Scientific Visualization Studio.
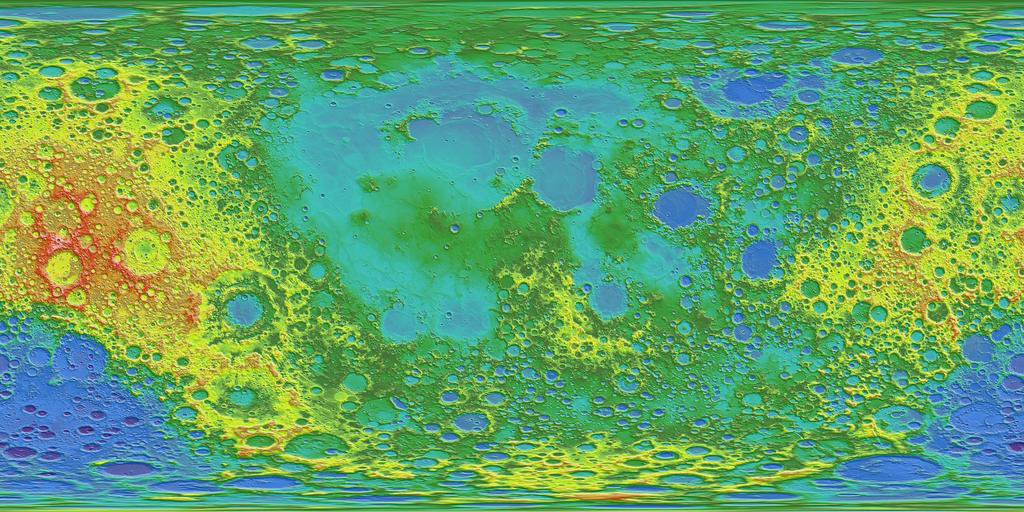
moon_crustal_thickness.png (1024x512)
The original image was obtained from the GRAIL Primary Mission Gravity Maps page in NASA Scientific Visualization Studio. Using Photoshop, the green and blue channels were darkened in the areas between 50 km to 60 km, which were originally colored toward white in the image (see link). This was done to have hue as the scale indicating thickness. Hence the upper bound was clipped at 50 km.
saturn_surface.png (2000x1000)
The original image was obtained from Solar Textures page on the Solar System Scope website, The 2K high resolution image was used as the starting point. The image was resized and saved to a png file.

saturn_rings_trans.png (100x1000)
The image originated from Expanse of Ice page in JPL and NASA Photojournal website. Using Photoshop, multiple operations were performed on the image. A two-pixel horizontal slice was extracted and then vertically expanded. Using the ‘Original Caption Released with Image’ information from the webpage, the pixels in the ring gaps were identified and made transparent. The image was rotated 90 degrees, with the outer ring at the image bottom. Finally, the image was resized and saved to a png file format. From the image information, the extent of the ring in the image was from 74,000 km to approximately 140,220 km.
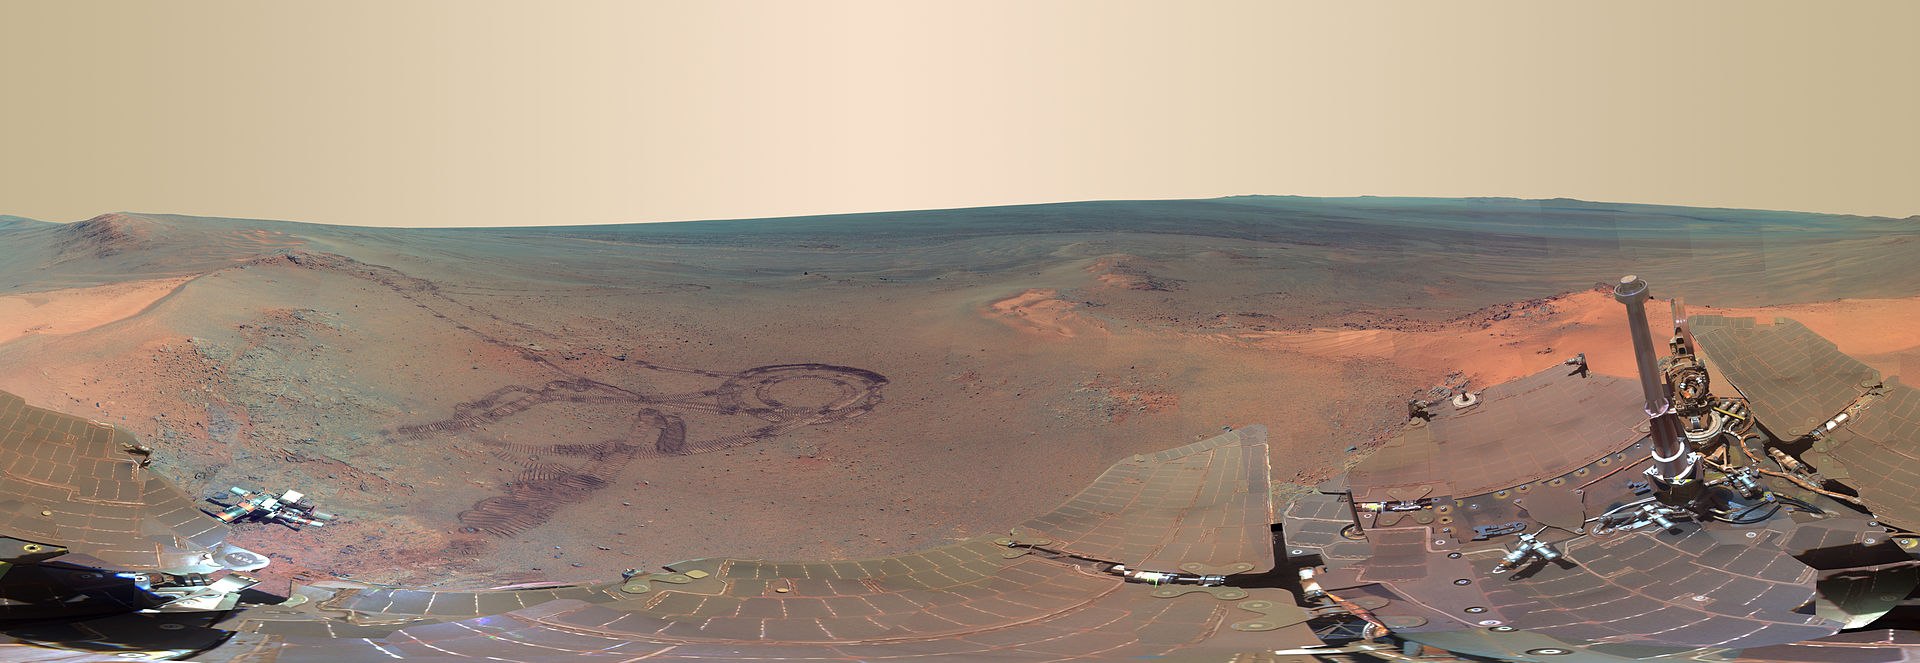
Greeley_Panorama.png (1920x663)
The image originated from Greeley Panorama’ from Opportunity’s Fifth Martian Winter page NASA website credited to NASA/JPL-Caltech/Cornell/Arizona State Univ. The particular image is the WMAP 5-Year CMB Map. The image was resized and saved in the png file format.
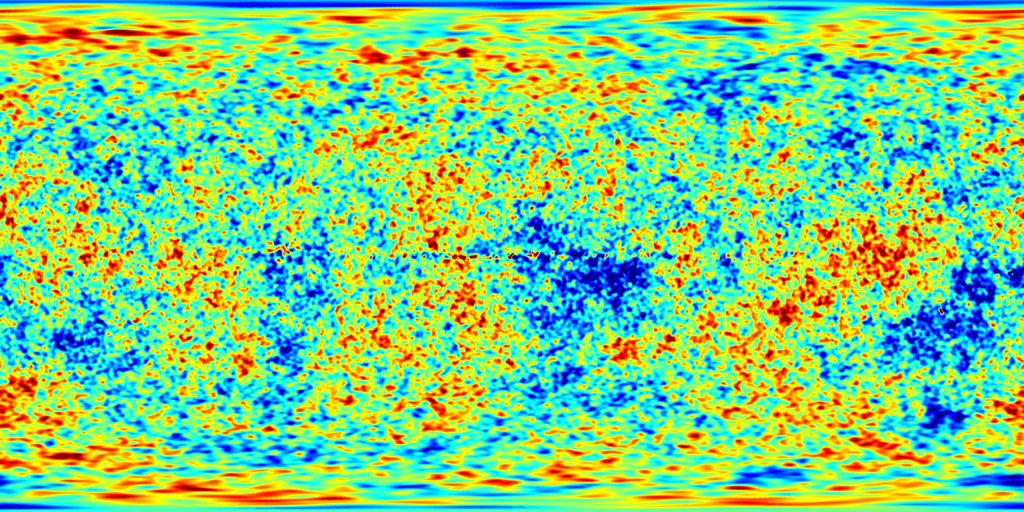
wmap.png (1024x512)
The image originated from WMAP Science on a Sphere Microwave Sky Images page in the Goddard Space Flight Center and NASA Lamdda - Data Products website. The particular image is the WMAP 5-Year CMB Map. The image was resized and saved in the png file format.
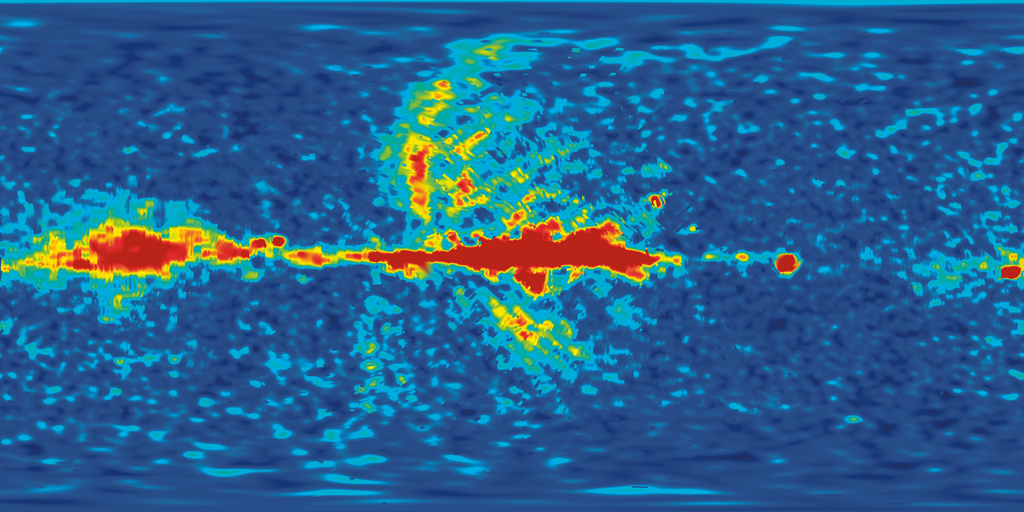
wmap_2.png (1024x512)
The image originated from WMAP Science on a Sphere Microwave Sky Images page in the Goddard Space Flight Center and NASA Lamdda - Data Products website. The particular image is the WMAP 5-Year Frequency Band Maps for Ka Band - 33 GHz. Using Photoshop, ‘gaps’ in the image were filled (only an approximation needed for the image example demonstration). The image was resized and saved in the png file format.
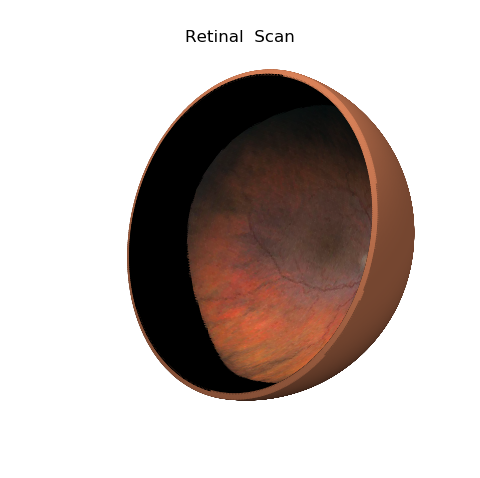
retinal_scan.png (900x900)
The image originated using a Zeiss Clarus 700 for ultra-widefield retinal imaging.
.jpg)
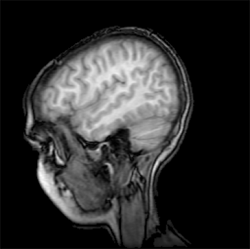
s1045.ima.gz (download link)
Used in the Matplotlib MRI and numerous other Matplotlib examples.
This data is used in numerous S3Dlib Examples.
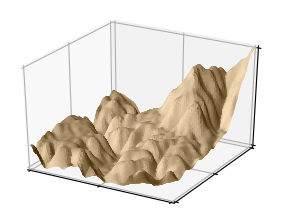
jacksboro_fault_dem.npz (download link)
Used in the Matplotlib Topographic hillshading and numerous other Matplotlib examples.
This data is used in numerous S3Dlib Examples.

palmerpenguins.csv (download link)
Data set was obtained from palmerpenguins on github. The illustration on the left is Artwork by @allison_horst. The data is used for the data visualization in the Palmer Penguin Data-set example.