
Object Collection Visualization
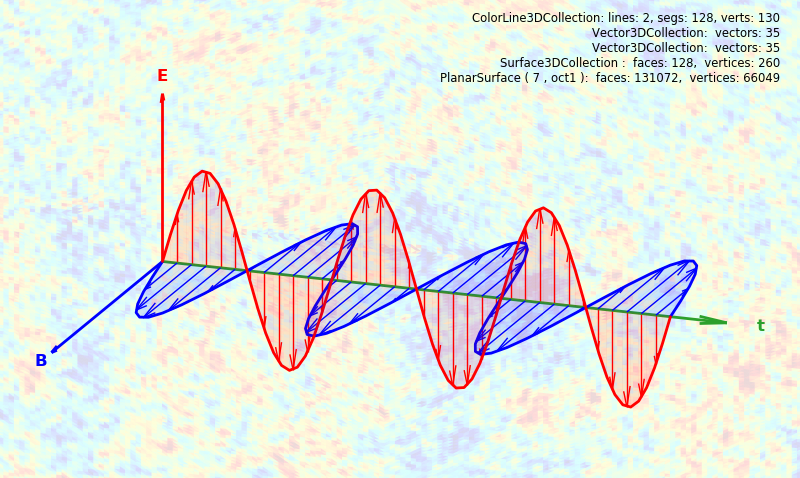
Vector, line and line-projection surface objects are added to the axes to produce the complete visualization. A background image is produced using an enlarged image mapped PlanarSurface.
The Python super method is used (highlighted line) to access the Surface3DCollection base class domain method. The domain method differs between these two classes using different calling arguments. For this particular PlanarSurface object, the plane is the y-z plane, not the default x-y plane.
import numpy as np
import matplotlib.pyplot as plt
import s3dlib.surface as s3d

#.. Line, Surface, and Vector Wave with background image surface.

# 1. Define function to examine .....................................
yLen, nVect, frequency, amplitude = 2.25, 36, 3, .85

vMag = lambda t : amplitude*np.sin(frequency*2*np.pi*t)

def wave(t,isX=True) :
    x = vMag(t)
    y = yLen*t
    z = np.zeros(len(t))
    return [x,y,z] if isX else [z,y,x]

zWave = lambda t : wave(t,False)

v = np.linspace(0,1,nVect)
vect_z =   np.array( [np.zeros(nVect), np.zeros(nVect), vMag(v)] ).T
vect_x =   np.array( [ vMag(v), np.zeros(nVect),np.zeros(nVect)] ).T
location = np.array( [ np.zeros(nVect),yLen*v, np.zeros(nVect) ] ).T

Y_axis =  lambda t : [ np.zeros(len(t)), yLen*t, np.zeros(len(t)) ]
Y_plane = lambda c : [ np.zeros(len(c[2])),c[0],c[1] ]

# 2. Setup and map surfaces .........................................
rez = 5
xColor,yColor,zColor = 'b', 'tab:green', 'red'

# .. wave lines ...
line_x = s3d.ParametricLine(rez,wave, color=xColor)
line_z = s3d.ParametricLine(rez,zWave,color=zColor)
comp_line = line_x + line_z
comp_line.set_linewidth(2)

# .. vector projections ...
VFx = s3d.Vector3DCollection(location,vect_x,lw=1,alr=0.2,color=xColor)
VFz = s3d.Vector3DCollection(location,vect_z,lw=1,alr=0.2,color=zColor)

# .. wave transparent surface ...
yline = s3d.ParametricLine(rez,Y_axis)
surf = line_z.get_surface_to_line(yline)
surf = surf + line_x.get_surface_to_line(yline)
surf.set_surface_alpha(0.1)
surf.set_linewidth(0.1)

# .. background image surface ...
bkgd_plane = s3d.PlanarSurface( 7, basetype='oct1', color='C1',lw=0)
bkgd_plane.map_color_from_image('data/wmap.png')
bkgd_plane.set_surface_alpha(0.15)
bkgd_plane.map_geom_from_op(Y_plane)
super(s3d.PlanarSurface,bkgd_plane).domain(  xlim=[-4,-2],ylim=[-3,3],zlim=[-5,2] )

# 3. Construct figures, add dasurfaces, and plot ....................
label = str(comp_line)+'\n' + str(VFx)+'\n' + str(VFz)+'\n' + str(surf)+'\n' + str(bkgd_plane)

fig = plt.figure(figsize=plt.figaspect(.6))
fig.text(0.975,0.975,label, ha='right', va='top', fontsize='smaller', multialignment='right')
ax = plt.axes(projection='3d',facecolor='w')
ax.set_axis_off()
s3d.setupAxis( ax, negaxis=False, length=[1.5,2.5,1.5],
                   color=[xColor,yColor,zColor], labels=['B','t','E'] , alr=0.05)
ax.set(xlim=(-1,1), ylim=(0.2,2), zlim=(-0.5,1.5) )
ax.view_init(30,20)
ax.set_proj_type('ortho')

ax.add_collection3d(comp_line)
ax.add_collection3d(VFx)
ax.add_collection3d(VFz)
ax.add_collection3d(surf)
ax.add_collection3d(bkgd_plane)

fig.tight_layout(pad=0)
plt.show()