
3D Lines
The following are examples of creating line collection objects and applying color to the object.
Line Construction
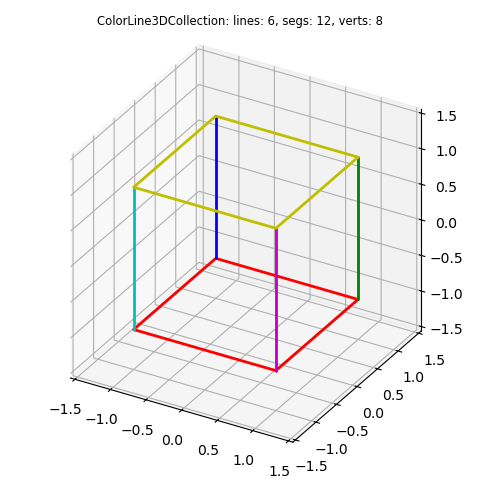
Base Class Lines
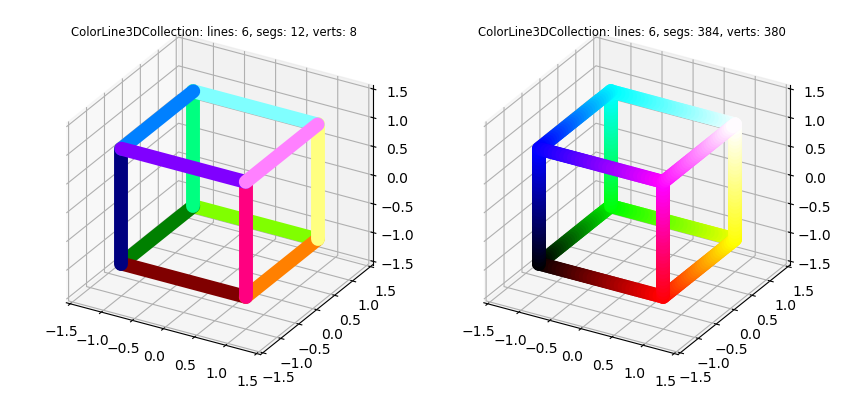
Line Segment Subdivision
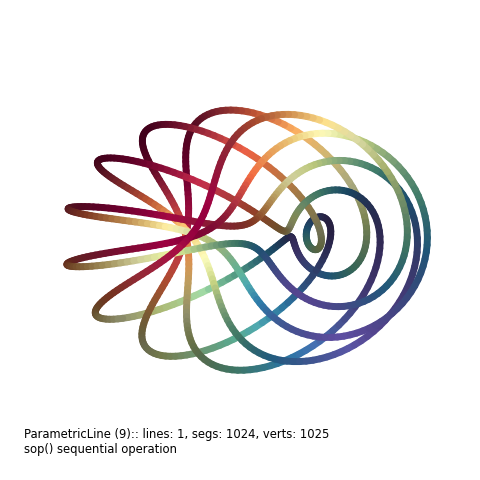
Line Colormap Sequence Operation
Segment Orientation Color
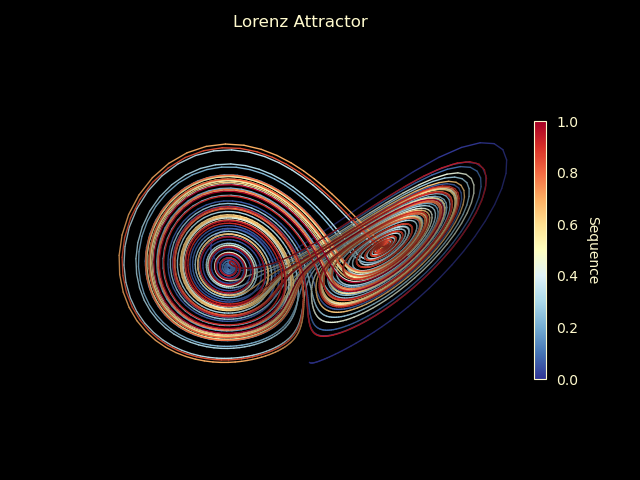
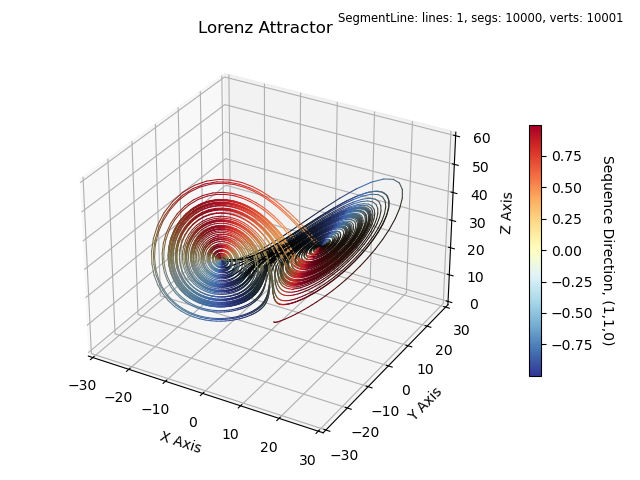
Sequential Line Color
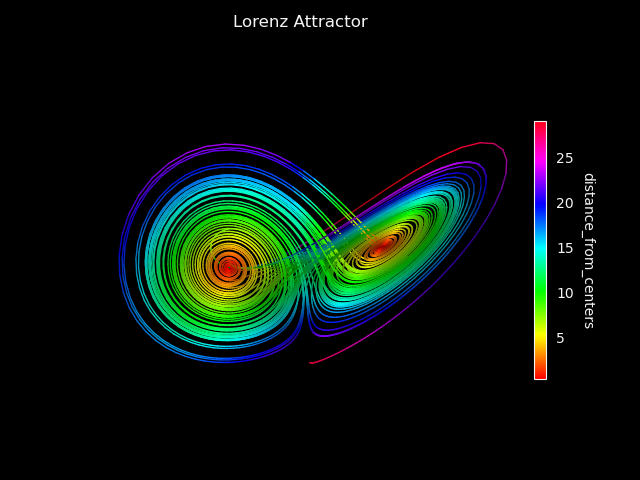
Functional Line Color
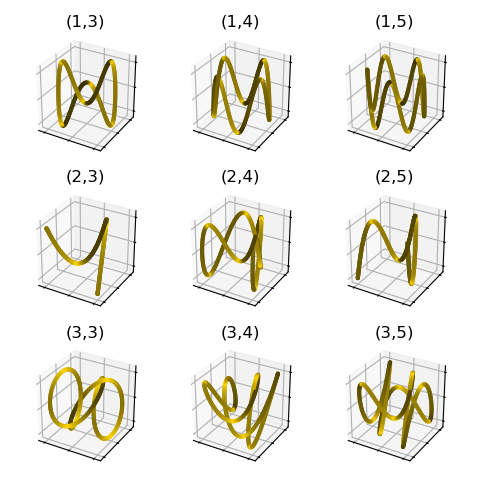
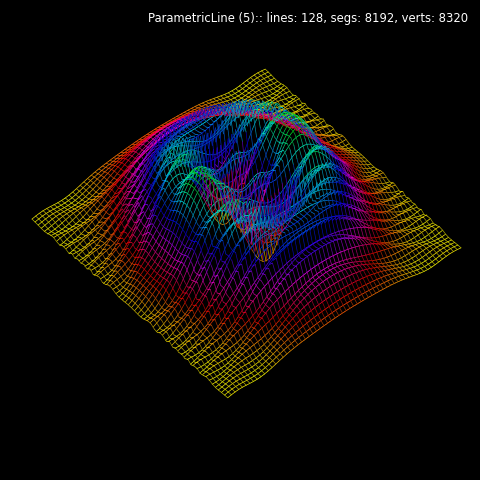
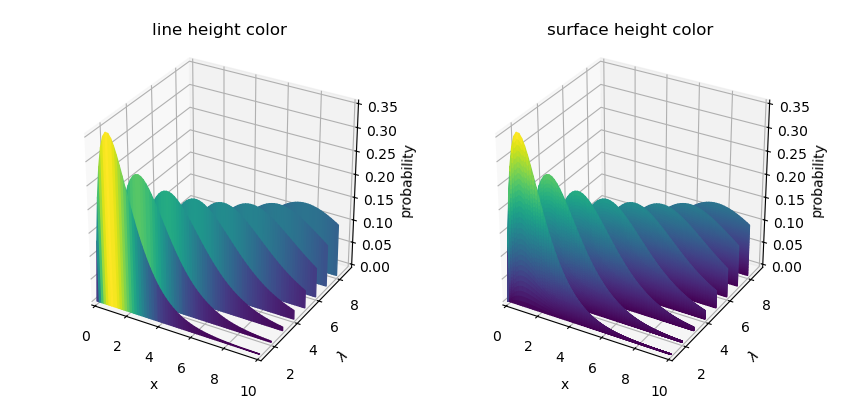
Parametric Set of Lines
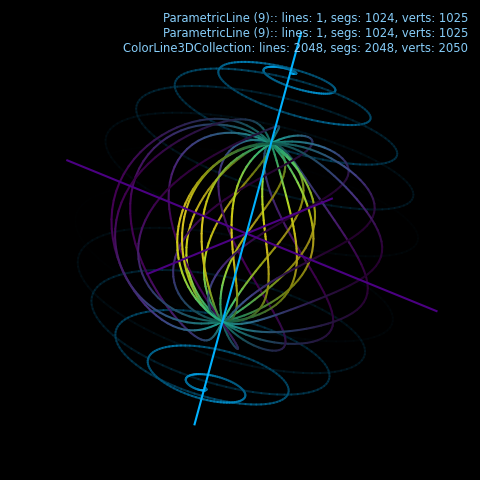
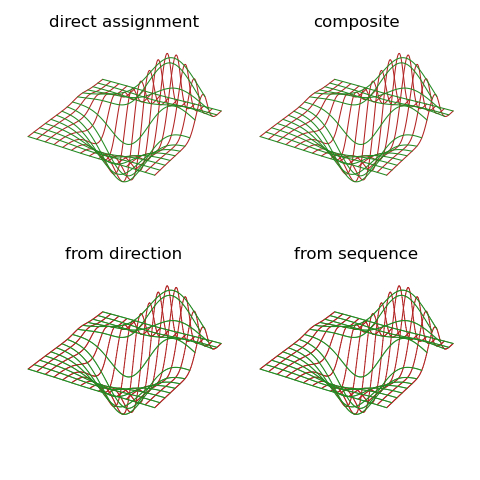
Line Composite
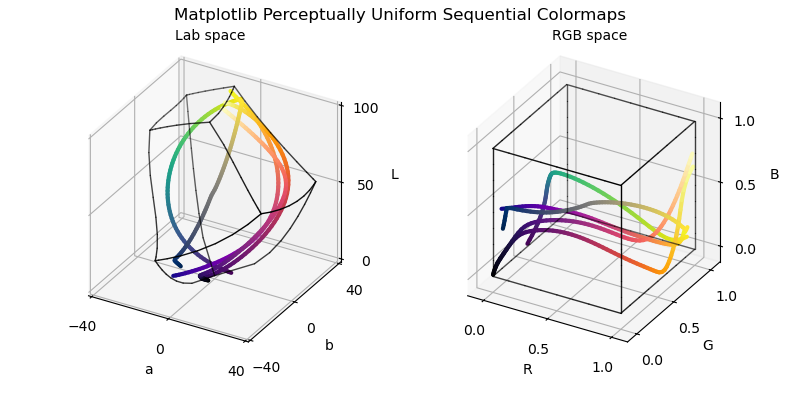
Matplotlib Colormaps
Face Edge Lines
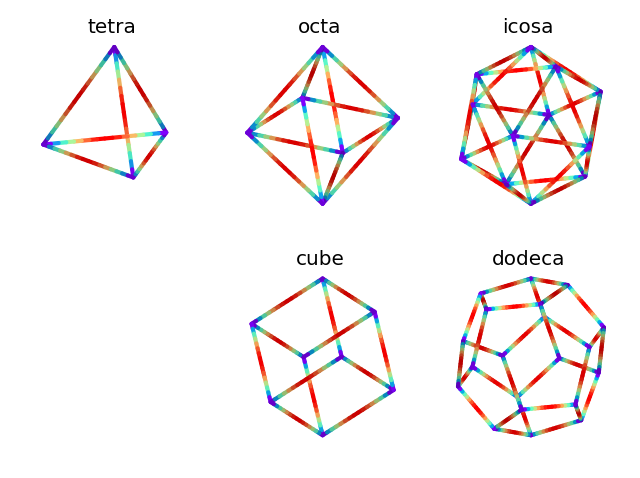
Platonic Solid Edges
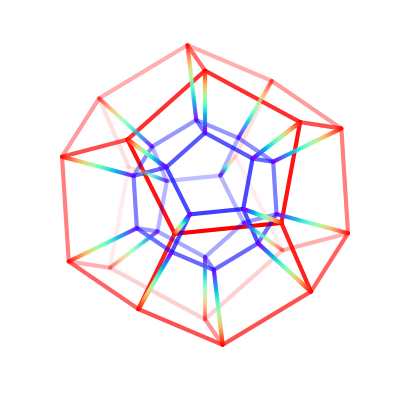
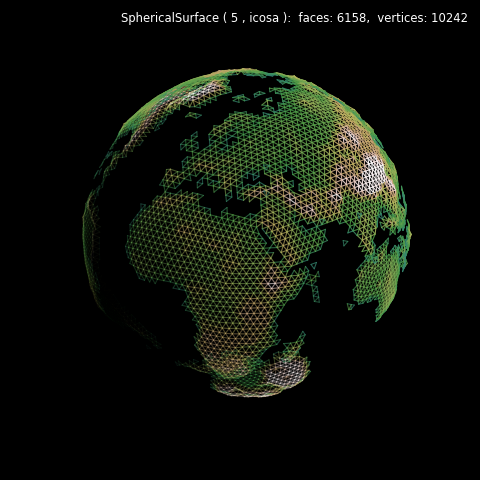
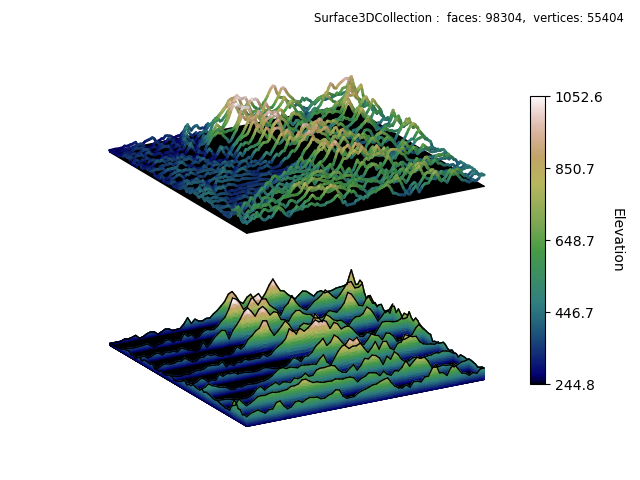
Lines from Surface Vertices

Face Edge Visualizations
Face Edges from Image HSV Value Clipping
Line Slices
Functional plots for z = f(x,y) of lines of constant x or y.
Datagrid XY Slices
Line Slice Wireframe Plots
Slice and Filled Slice Datagrid
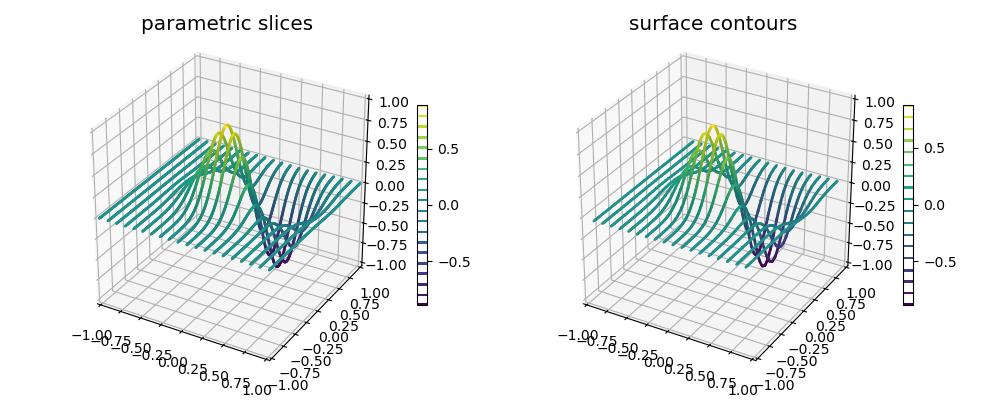
Parametric Slices and Surface Contours
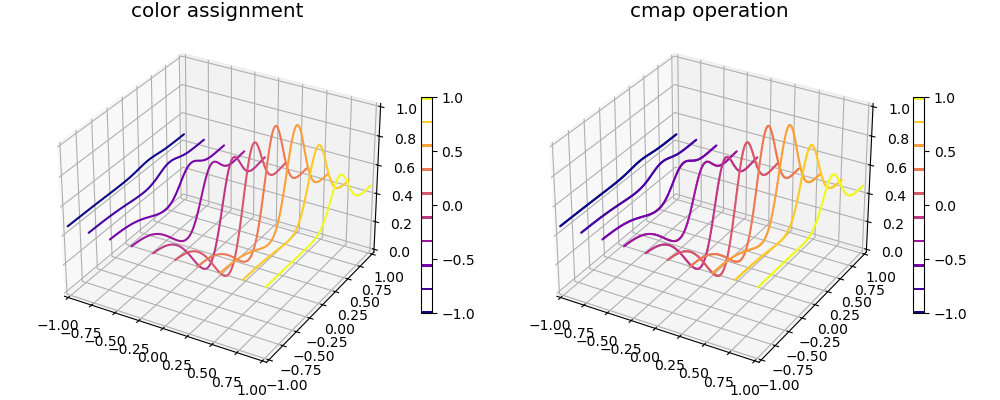
Color Assignment and Colormap Slices
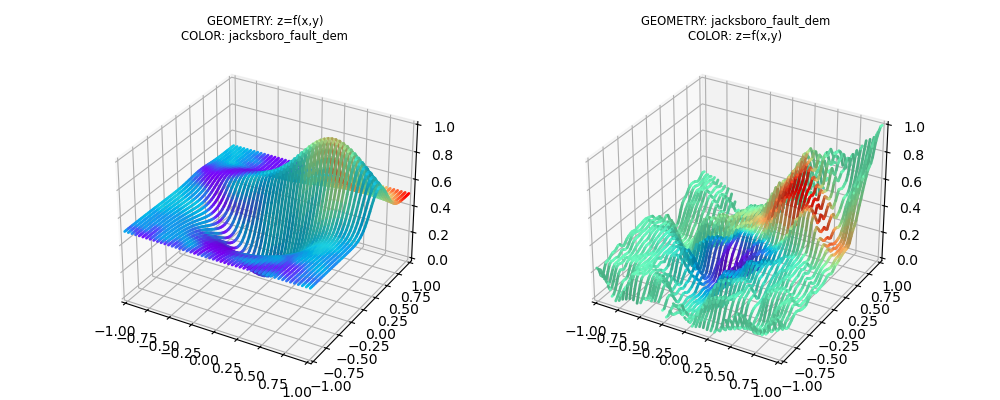
Surface Slice Color Methods
SliceSet Geometry and Color
Datagrid XY Filled Slices
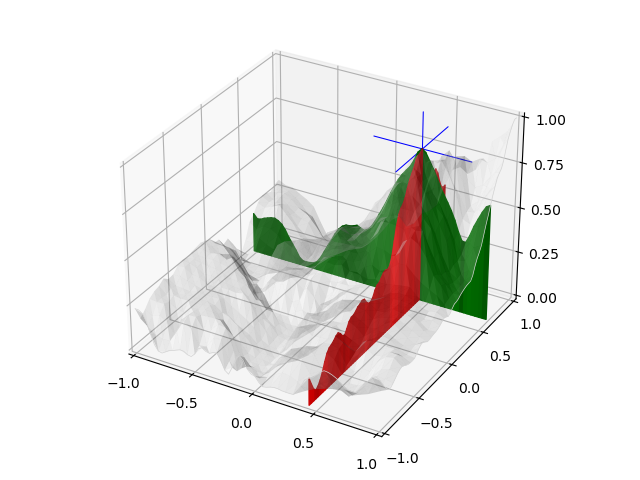
Comparison of Filled Slice Coloring
Multiple X and Y Slice Surfaces