
Four-Color DualCmap
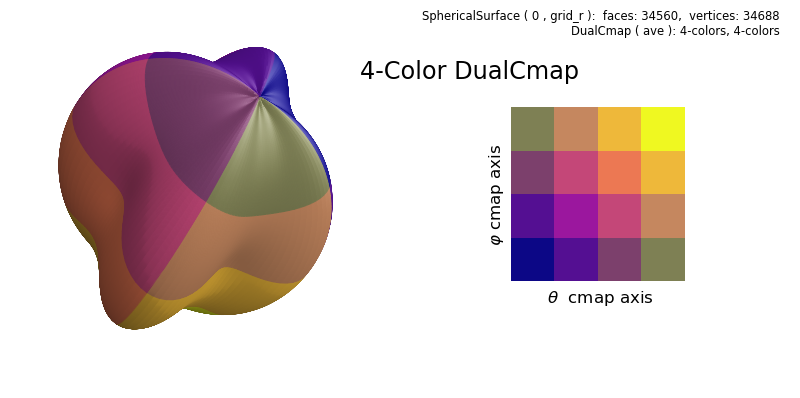
The DualCmap object is constructed from a pair of the colormaps used in the Segmented Cmap Operation example:

Note that using the kind=’ave’ argument in the DualCmap constructor results in the diagonals of the dual colormap colors equal to the colors of the origin colormap.
import numpy as np
from matplotlib import pyplot as plt
from matplotlib import colormaps
from matplotlib.colors import ListedColormap
import s3dlib.surface as s3d
import s3dlib.cmap_utilities as cmu

#.. Four-Color DualCmap
# 1. Define function to examine .....................................

fourColors = colormaps['plasma'](np.linspace(0, 1, 4))
fourColor_cmap = ListedColormap(fourColors)
fourColor_cmap.name="4-colors"
cmap2d = cmu.DualCmap(fourColor_cmap,fourColor_cmap,kind='ave')

def deflate(rtp) :
    r,t,p = rtp
    scale = 0.2
    Rz = np.cos(p)
    Rxys = (1-scale)*np.sin(p) + scale*np.cos(4*t)
    R = np.sqrt( Rz**2 + Rxys**2)
    return R,t,p

# 2. Setup and map surfaces .........................................

surface = s3d.SphericalSurface.grid(270,32*4,'r')
dualmap = lambda c : cmap2d(c[1],c[2])
surface.map_color_from_op( dualmap )
surface.map_geom_from_op(deflate)
surface.transform(s3d.eulerRot(-10,35,25,useXconv=False))

N = 200
x=np.linspace(0,1,N)
y=np.linspace(0,1,N)
z = cmap2d(*np.meshgrid(x, y)).T

# 3. Construct figures, add surface, plot ...........................
info = str(surface) +'\n' + str(cmap2d)
minmax = (-0.5*N,1.5*N)
fig = plt.figure(figsize=(8,4))
fig.text(0.975,0.975,info, ha='right', va='top', fontsize='smaller', multialignment='right')

ax1 = fig.add_subplot(121, projection='3d', aspect='equal')
fig.text(0.45,0.85,"4-Color DualCmap", ha='left',
    va='top', fontsize='xx-large', multialignment='right')
ax1.set_axis_off()
s3d.auto_scale(ax1,surface,uscale=0.65)
ax1.add_collection3d(surface.shade(.3,contrast=1.5).hilite(.5))

ax2 = fig.add_subplot(122)
fig.text(0.75,0.23,r'$\theta$  cmap axis', ha='center', va='center', fontsize='large')
fig.text(0.61,0.51,r'$\varphi$ cmap axis', ha='center', va='center', fontsize='large', rotation=90)
ax2.set(xlim=minmax, ylim=minmax )
ax2.set_axis_off()
ax2.imshow(z)

fig.tight_layout()
plt.show()