
Segmented Cmap Operation
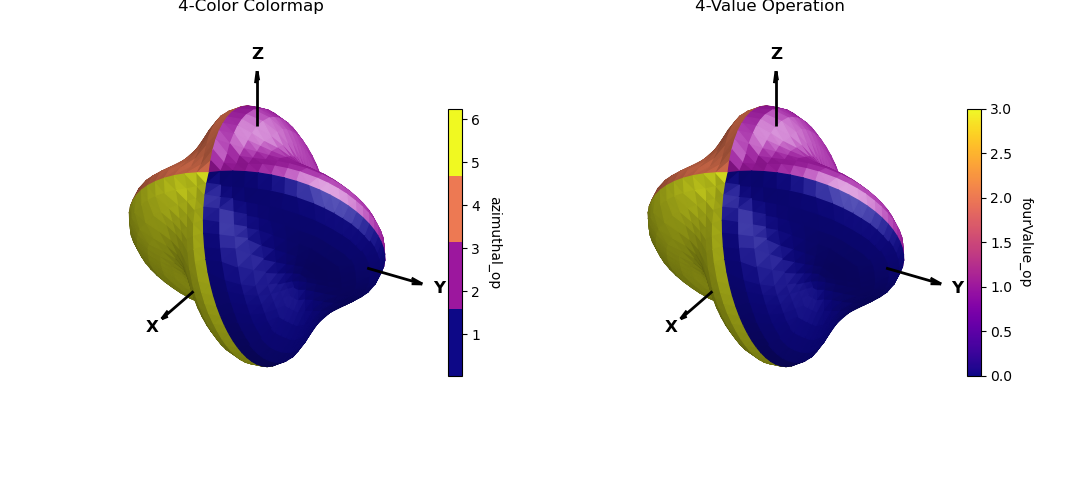
This example demonstrates two methods of applying identical surface coloring. The only difference is the resulting colorbar reference. Note: the fourColor_cmap could alternatively be created with the matplotlib.colors import ListedColormap for this simple color map.
import numpy as np
import matplotlib.pyplot as plt
from matplotlib import cm,colormaps
import s3dlib.surface as s3d
import s3dlib.cmap_utilities as cmu

#.. Segmented Cmap Operation

# # 1. Define functions to examine ....................................

def azimuthal_op(rtp) : return rtp[1]

def fourValue_op(rtp) : return [ int(2*t/np.pi) for t in rtp[1] ]

# ...................
def deflate(rtp) :
    r,t,p = rtp
    scale = 0.2
    Rz = np.cos(p)
    Rxys = (1-scale)*np.sin(p) + scale*np.cos(4*t)
    R = np.sqrt( Rz**2 + Rxys**2)
    return R,t,p

# 2. Setup and mapsurfaces .........................................
rez,illum  = 4,  [0,1,1]
fourColors = colormaps['plasma'](np.linspace(0, 1, 4))
fourColor_cmap = cmu.stitch_color(*fourColors)

surfaces = [None]*2
surfaces[0] = s3d.SphericalSurface(rez,basetype='octa',name='4-Color Colormap')
surfaces[0].map_cmap_from_op(azimuthal_op, fourColor_cmap )

surfaces[1] = s3d.SphericalSurface(rez,basetype='octa',name='4-Value Operation')
surfaces[1].map_cmap_from_op(fourValue_op, 'plasma'       )

# 3. Construct figure, addsurfaces, and plot ......................

fig = plt.figure(figsize=plt.figaspect(0.45))
for i, surface in enumerate(surfaces) :
    surface.map_geom_from_op(deflate)
    surface.transform(s3d.eulerRot(-10,35,25,useXconv=False))

    ax = fig.add_subplot(121+i, projection='3d', aspect='equal')
    ax.set(xlim=(-1,1), ylim=(-1,1), zlim=(-1,1))
    s3d.standardAxis( ax, offset=1.0 )
    cbar = plt.colorbar(surface.cBar_ScalarMappable, ax=ax, shrink=0.6, pad=-.05 )
    cbar.set_label(surface.cname, rotation=270, labelpad = 15)
    ax.set_title(surface.name)

    ax.add_collection3d(surface.shade(.3,illum).hilite(.7,illum))

fig.tight_layout()
plt.show()