
Dini Surface Animation

Animation control:
Visualization |
Frame Value |
|---|---|
Surface geometry |
multitple functional parameters per frame |
Surface position |
functional z-coordinate axis parameter per frame |
Surface color |
constant |
Shading and highlighting |
fixed to the coordinate axis |
Axis coordinate |
constant |
Based on the static plot from the Polar Coordinates to XYZ example.
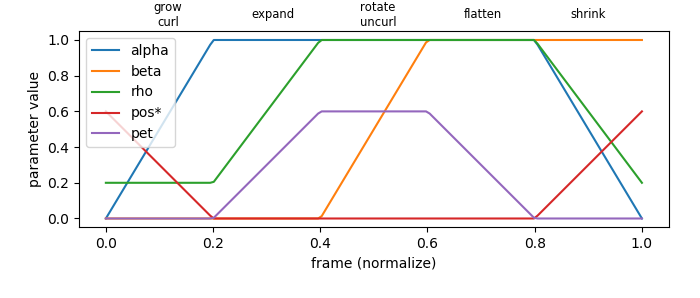
Multiple ‘constants’ values for the Dini surface parametric equations were varied along the frame. The values were varied in a linear segmented function of the frame using the s3d.frame_to_value function to provide the multiple steps in the animation. In addition, a mapping of the PolorSurface radius was used to provide the effect of the ‘petals.’ The first mapping was the radial distance of the initial polar surface (petals) which was then followed by the dini transformation. Also, a following transformation was used to adjust the vertical length during the animation.
A custom color map was created to suggest a flower surface.

import copy
import numpy as np
from matplotlib import pyplot as plt
from matplotlib.animation import FuncAnimation
import s3dlib.surface as s3d
import s3dlib.cmap_utilities as cmu

#.. Animation demo using a parametric frame history.

# 0. Define animation control parameters ............................

totalTime, f_domain, numFrames = 15, (0.0,1.0), 150   # time in seconds
frames=np.linspace(*f_domain, numFrames, endpoint=False)
interval = int(1000.0*totalTime/numFrames)          # milliseconds

# 1. Define function to examine .....................................

# parameter = f( frmae position )
mrh,mps,mpd = 0.2, -6, 0.6 # smallest radius, position, petal depth
alf_list = [ 0.0, 1.0, 1.0, 1.0, 1.0, 0.0 ]
bet_list = [ 0.0, 0.0, 0.0, 1.0, 1.0, 1.0 ]
rho_list = [ mrh, mrh, 1.0, 1.0, 1.0, mrh ]
pos_list = [ mps, 0.0, 0.0, 0.0, 0.0, mps ]
pet_list = [ 0.0, 0.0, mpd, mpd, 0.0, 0.0 ]

def getParams(f):
    return s3d.frame_to_value(f,alf_list,bet_list,rho_list,pos_list,pet_list)

def petals(rtz,depth,numb=7) :
    r,t,z = rtz
    sc = 1 - depth*(  0.5*(1+np.cos(numb*t))  )
    return sc*r,t,z

def dinisurf2(rtz,alpha,beta,rho) :
    r,t,z = rtz
    a, b = 1.5, 0.2
    R = rho*r
    b = b*(1-beta)
    T = (1+np.abs(alpha-beta))*t
    x = a*np.cos(T)*np.sin(R)
    y = a*np.sin(T)*np.sin(R)
    z = a*(np.cos(r) + np.log(np.tan(r/2))) + b*T
    return x,y,z*alpha

# 2. Setup and map surfaces .........................................
rez, start_f = 6, .5
cmap1 = cmu.hsv_cmap_gradient( 'green','cornsilk',smooth=1 )
cmap2 = cmu.hsv_cmap_gradient( 'cornsilk','lightsalmon',smooth=.5 )
cmap = cmu.stitch_cmap(cmap1,cmap2)

base = s3d.PolarSurface(rez, basetype='hex_c', minrad=0.01)
base.map_cmap_from_op( lambda rtz: rtz[0] , cmap=cmap )
surface = copy.copy(base)
alpha, beta, rho, pos, pet = getParams(start_f)
surface.map_geom_from_op( lambda rtz: petals(rtz,pet) )
surface.map_geom_from_op( lambda rtz: dinisurf2(rtz,alpha,beta,rho), returnxyz=True )
surface.shade().hilite(focus=3)
surface.transform(translate=[0,0,pos])

# 3. Construct figures, add surface, plot ...........................

fig = plt.figure(figsize=plt.figaspect(1),facecolor='k')
ax = plt.axes(projection='3d',facecolor='k',aspect='equal')
s=1.5
minmax=(-.75*s,.75*s)
ax.set(xlim=minmax, ylim=minmax, zlim=(-3*s,s) )
ax.set_axis_off()
ax.view_init(elev=25)

ax.add_collection3d(surface)

fig.tight_layout()
#plt.show()

# 4. Animation ======================================================

def update_fig(frame):
    global surface
    surface.remove()
    surface = copy.copy(base)
    alpha, beta, rho, pos, pet = getParams(frame)
    surface.map_geom_from_op( lambda rtz: petals(rtz,pet) )
    surface.map_geom_from_op( lambda rtz: dinisurf2(rtz,alpha,beta,rho), returnxyz=True )
    surface.shade().hilite(focus=3)
    surface.transform(translate=[0,0,pos])

    ax.add_collection3d(surface)
    return

anim = FuncAnimation(fig, update_fig, frames, interval=interval, repeat=True)
anim.save('dini.html',writer='html')

msg = "saved {} frames, values: [{:.3f} to {:.3f}] @ {} milliseconds/frane"
print(msg.format(numFrames,np.min(frames),np.max(frames),interval))
The script to construct the plot of the parameter values per frame follows:
import numpy as np
import matplotlib.pyplot as plt
import s3dlib.surface as s3d

# 1. Define function to examine ...............

# parameter = f( frmae position )
mrh,mps,mpd = 0.2, -6, 0.6 # smallest radius, position, petal depth
alf_list = [ 0.0, 1.0, 1.0, 1.0, 1.0, 0.0 ]
bet_list = [ 0.0, 0.0, 0.0, 1.0, 1.0, 1.0 ]
rho_list = [ mrh, mrh, 1.0, 1.0, 1.0, mrh ]
pos_list = [ mps, 0.0, 0.0, 0.0, 0.0, mps ]
pet_list = [ 0.0, 0.0, mpd, mpd, 0.0, 0.0 ]

def getParams(f):
    return s3d.frame_to_value(f,alf_list,bet_list,rho_list,pos_list,pet_list)

# 2. Setup and map lines ......................
mps = 0.6  # adjust only for plotting
pos_list = [ mps, 0.0, 0.0, 0.0, 0.0, mps ]

N = 150
frames = np.linspace(0.0, 1.0, N)
pVals = [ getParams(f) for f in frames ]
yVals = [ list(val) for val in list(zip(*pVals)) ]  #transpose

fig = plt.figure(figsize=(7,3))
ax = plt.axes()
plt.xlabel('frame (normalize)')
plt.ylabel('parameter value')
labels = ['alpha','beta','rho','pos*','pet']
steps = [ 'grow\ncurl', 'expand', 'rotate\nuncurl', 'flatten','shrink']

for i in range(5) :
    ax.plot(frames, yVals[i], label=labels[i])
    fig.text(0.24+0.15*i,0.95,steps[i], ha='center', va='center', fontsize='small')
plt.legend()
fig.tight_layout(pad=2)
plt.show()