Complex Number to a Power
Animation control:
Visualization |
Frame Value |
|---|---|
Surface geometry |
functional parameter per frame |
Surface position |
fixed to the coordinate axis |
Surface color |
color per frame |
Shading and highlighting |
fixed to the coordinate axis |
Axis coordinate |
constant |
Based on the static plots from the Parametric Set example.
import numpy as np
import matplotlib.pyplot as plt
from matplotlib.animation import FuncAnimation
import s3dlib.surface as s3d
import s3dlib.cmap_utilities as cmu

# 0. Define animation control parameters ............................

totalTime, f_domain, numFrames = 14, (0.0,1.0), 120   # time in seconds
frames=np.linspace(*f_domain, numFrames, endpoint=False)
interval = int(1000.0*totalTime/numFrames)          # milliseconds

# 1. Define functions to examine ....................................

real = True
imaginary =  not real

def pover_Z(rtz, isReal, N) :
    r,t,z = rtz
    A = np.power(r,N)
    alpha = N*t if N>1 else t
    if isReal : Z = A*np.cos(alpha)
    else :      Z = A*np.sin(alpha)
    return r,alpha/N,Z

elev,azim,lightDir = 20, -150, [1,0,1]

xpont = [0.333, 0.5,  1,   2,    3]                         # exponents, n
ticPs = [0,     0.25, 0.5, 0.75, 1]                         # colorbar tick positions
ticLb = [r'$\frac{1}{3}$', r'$\frac{1}{2}$', '1', '2', '3'] # colorbar labels

val =           lambda b : s3d.frame_to_value(b,xpont)[0]   # linear segment path
frame_to_beta = lambda f : 2*f if f<0.5 else 2*(1-f)        # forward to reverse sequence

def indicator_by_A(fig, A, vOld=None) :
    # 0 < A < 1
    symbol, blank = r'$\blacktriangleright$', r'$\blacksquare$'
    horz, vCen, vRng = 0.825, 0.467, 0.26
    vert = vCen + vRng*(2*A-1)
    if vOld is not None:
        fig.text(horz,vOld,blank, ha='right', va='center', fontsize='x-large', color='w')
    fig.text(horz,vert,symbol, ha='right', va='center', fontsize='large')
    return vert

# 2. Setup and map surfaces .........................................
frame = 0.0
beta = frame_to_beta(frame)
V = val(beta)

rez=5
zMap = cmu.hsv_cmap_gradient( [.5,1,1], [1.5,1,1] )

surface = s3d.PolarSurface(rez, 'squ_c', cmap=zMap)
surface.map_cmap_from_op( lambda rtz : pover_Z(rtz,imaginary,V)[2] )
surface.map_geom_from_op( lambda rtz : pover_Z(rtz,real,V) )

# 3. Construct figure, add surfaces, and plot .....................

rtv = s3d.rtv(lightDir,elev,azim)
minmax = (-1,1)
sm = plt.cm.ScalarMappable(cmap=cmu.binary_cmap('k','w'))
sm.set_array([])

fig = plt.figure(figsize=plt.figaspect(0.9))
ax = plt.axes(projection='3d', aspect='equal')
ax.set_title( r'f(z) =  $z^n$', fontsize='xx-large' )
ax.view_init(elev,azim)
ax.set(xlim=minmax, ylim=minmax, zlim=minmax)
cbar = plt.colorbar(sm, ax=ax,  shrink=0.6, pad=-.05, aspect=50, ticks=ticPs )
cbar.set_label('Exponent, n', rotation=270, labelpad = 15)
cbar.ax.set_yticklabels(ticLb)
ax.set_axis_off()

ax.add_collection3d(surface.shade(0,rtv))
prevIndicator = indicator_by_A(fig, beta)

fig.tight_layout()
#plt.show()

# 4. Animation ======================================================

def update_fig(frame):
    global surface
    global prevIndicator
    surface.remove()

    beta = frame_to_beta(frame)
    V = val(beta)

    surface = s3d.PolarSurface(rez, 'squ_c', cmap=zMap)
    surface.map_cmap_from_op( lambda rtz : pover_Z(rtz,imaginary,V)[2] )
    surface.map_geom_from_op( lambda rtz : pover_Z(rtz,real,V) )
    surface.shade(0,rtv)
    prevIndicator = indicator_by_A(fig, beta, prevIndicator)

    ax.add_collection3d(surface)
    return

anim = FuncAnimation(fig, update_fig, frames, interval=interval, repeat=True)
anim.save('complex.html',writer='html')

msg = "saved {} frames, values: [{:.3f} to {:.3f}] @ {} milliseconds/frane"
print(msg.format(numFrames,np.min(frames),np.max(frames),interval))
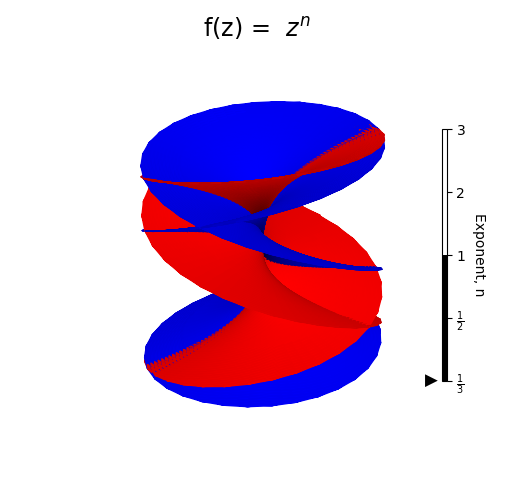
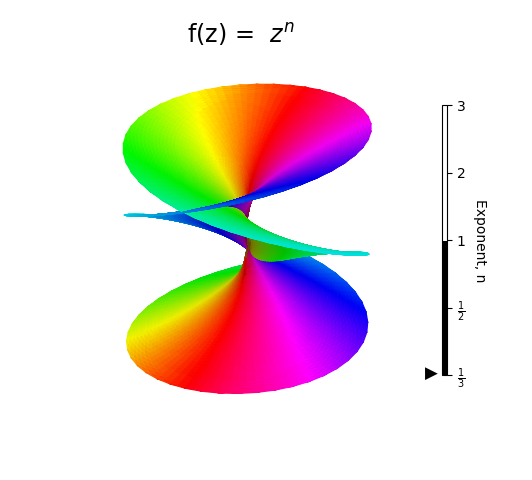
In the above animation, the real and imaginary components are respresented by geometry and color, respectively. Changeing the highlighted lines in the above script by:
surface_I = s3d.PolarSurface(5,'hex_c', facecolor='red')
surface_I.map_geom_from_op( lambda rtz : pover_Z(rtz,imaginary,V) )
surface_R = s3d.PolarSurface(5,'hex_c', facecolor='blue')
surface_R.map_geom_from_op( lambda rtz : pover_Z(rtz,real,V) )
surface = surface_I + surface_R
both real and imaginary componets are represented as blue and red surfaces, as shown below: