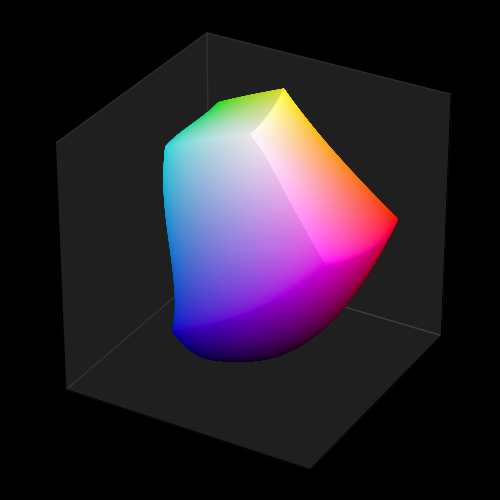
Lab Color Space

Animation control:
Visualization |
Frame Value |
|---|---|
Surface geometry |
constant |
Surface position |
rotation transform per frame |
Surface color |
constant |
Shading and highlighting |
fixed to the coordinate axis |
Axis coordinate |
constant |
Based on the static plot from the Color Space example.
To minimize execution time, the Lab surface object was constructed once, then copied for each frame construction. Rotating the copied surface and shading results in ‘stationary viewer’ perception.
import copy
import numpy as np
from matplotlib import pyplot as plt
from matplotlib.animation import FuncAnimation
import matplotlib.animation as animation
from colorspacious import cspace_converter
import s3dlib.surface as s3d

#.. Lab Surface Rotation Animation

# 0. Define animation control parameters ............................

totalTime, f_domain, numFrames = 10, (0.0,1.0), 100   # time in seconds
frames=np.linspace(*f_domain, numFrames, endpoint=False)
interval = int(1000.0*totalTime/numFrames)          # milliseconds

# 1. Define function to examine ....................................

def rgb_to_labCoor(rgb):
    L,a,b = cspace_converter("sRGB1", "CAM02-UCS"  )(rgb.T).T
    return a/80,b/80,L/100

# Setup surface ................................................
rez=6

surface = s3d.CubicSurface().domain([0,1],[0,1],[0,1]).triangulate(rez)
surface.map_color_from_op(lambda xyz : xyz)
surface.map_geom_from_op(rgb_to_labCoor)
surface.transform(scale=2,translate=[0.0,0.0,-1])
surfcopy = copy.copy(surface)

start_f = 0
theta = 360*start_f
surface.transform(s3d.eulerRot(theta,0)).shade(.5)

# Construct figure, add surface, plot ..........................
plt.rcParams['grid.color'] = '.2'
minmax,paneColor  = (-1.1,1.1), '.05'
fig = plt.figure(figsize=(5,5), facecolor='k')
ax = plt.axes(projection='3d', facecolor='k', aspect='equal')
ax.set(xlim=minmax, ylim=minmax, zlim=minmax,
       xticks=minmax, yticks=minmax, zticks=minmax )
ax.xaxis.set_pane_color(paneColor)
ax.yaxis.set_pane_color(paneColor)
ax.zaxis.set_pane_color(paneColor)
ax.add_collection3d(surface)

fig.tight_layout(pad=0)
#plt.show()

# 4. Animation ======================================================

def update_fig(frame):
    global surface
    surface.remove()
    theta = 360*frame
    surface = copy.copy(surfcopy)
    surface.transform(s3d.eulerRot(theta,0)).shade(.5)

    ax.add_collection3d(surface)
    return

anim = FuncAnimation(fig, update_fig, frames, interval=interval, repeat=True)
anim.save('lab_rot.html',writer='html')

msg = "saved {} frames, values: [{:.3f} to {:.3f}] @ {} milliseconds/frane"
print(msg.format(numFrames,np.min(frames),np.max(frames),interval))
