
Composite Surface Contour Projections
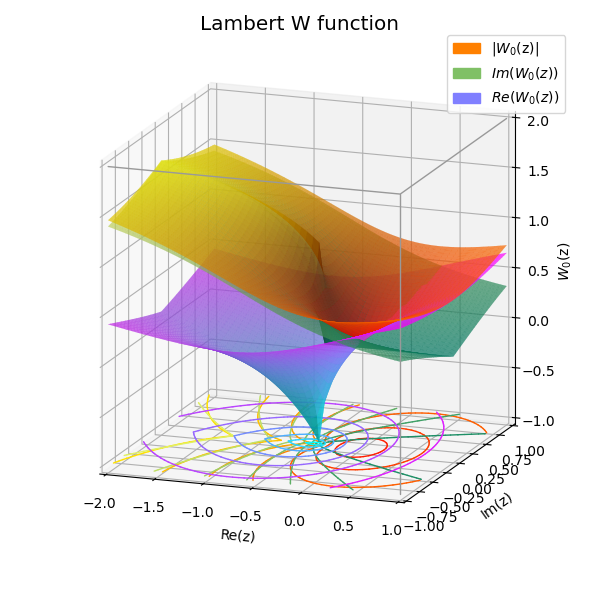
The Lambert W function is defined using the SciPi special lambertw method. The various parts of the complex value are plotted as separate surface contours.
import numpy as np
from matplotlib import pyplot as plt
from matplotlib import colormaps,patches
from scipy import special as sp
import s3dlib.surface as s3d

# Composite Surface Contour Projections

# 1. Define function to examine .....................................

def LambertW(xyz) :
		z = xyz[0] + xyz[1]*1j
		return sp.lambertw(z)

absv_lamb = lambda c : [c[0],c[1],np.abs(LambertW(c)) ]
imag_lamb = lambda c : [c[0],c[1],np.abs(LambertW(c).imag) ]
real_lamb = lambda c : [c[0],c[1],LambertW(c).real]

# 2. Setup and map surfaces .........................................
offset = -1.0
cntrl = [ [absv_lamb, 'autumn', r'|$W_0$(z)|'],
          [imag_lamb, 'summer', r'$Im( W_0(z) )$'],
          [real_lamb, 'cool'  , r'$Re( W_0(z) )$'] ]

surface,contours,handle = None,None,[]
for i,[func,cmap,lbl] in enumerate(cntrl) :
	s = s3d.PlanarSurface.grid(50,50,cmap=cmap).domain( (-2,1),(-1,1) )
	s.map_geom_from_op( func ).map_cmap_from_op( )
	c = s.contourLineSet(7).map_to_plane(offset)
	surface = s if surface is None else surface+s
	contours = c if contours is None else contours+c
	handle.append( patches.Patch(color=colormaps[cmap](.5), label=lbl) )

surface.set_surface_alpha(.7)
surface.shade(.1,direction=[-1,0,2])
contours.set_linewidth(1)

vE,iE = [ [-2,-1,2], [1,-1,2], [1,1,2], [1,-1,-1] ], [ [0,1,2],[1,3]]
# 3. Construct figure, add surface, plot ............................

fig = plt.figure(figsize=(6,6))
fig.text(.5,.95,'Lambert W function',ha='center',fontsize='x-large')
ax = plt.axes(projection='3d', aspect='equal', proj_type='ortho')
ax.view_init(15,-70)
ax.set(xlabel='Re(z)',ylabel='Im(z)',zlabel=r'$W_0$(z)',
	xlim=(-2,1),ylim=(-1,1),zlim=(-1,2))
ax.legend(handles=handle)

ax.add_collection3d(surface)
ax.add_collection3d(contours)
ax.add_collection3d( s3d.ColorLine3DCollection(vE,iE,color='0.6',lw=1) )

fig.tight_layout(pad=2)
plt.show()