
Class Surfaces
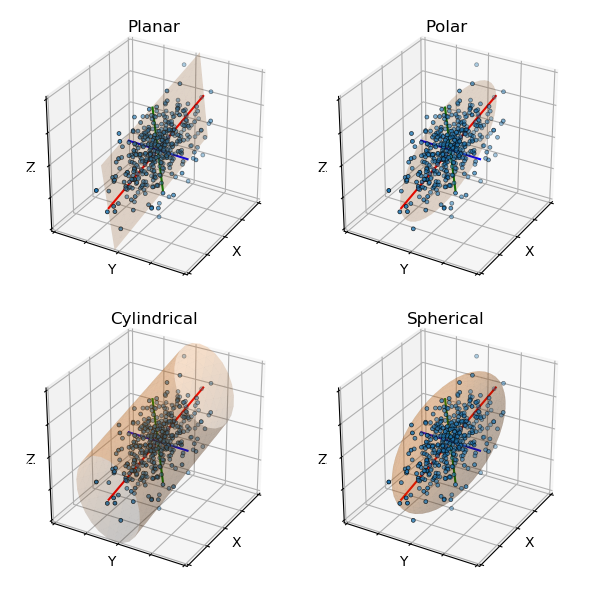
The cylindrical surface object was rotated so that the major transformed axis is along the original cylindrical z-axis (highlighted line).
import numpy as np
import matplotlib.pyplot as plt
from matplotlib import cm
import s3dlib.surface as s3d

#.. Surface Class Visualization

# 1. Define data to examine .........................................
np.random.seed(1)

def get_correlated_dataset(n, dependency, mu, scale):
    latent = np.random.randn(n, 3)
    dependent = latent.dot(dependency)
    scaled = dependent * scale
    scaled_with_offset = scaled + mu
    # return x y z of the new, correlated dataset
    return scaled_with_offset[:, 0], scaled_with_offset[:, 1], scaled_with_offset[:, 2]

corr = np.array([ [0.85, -.15, 0.4], [-0.35, -0.65, 0.7], [-.4, 0.6, 1.0] ])
mu = 0,0,0
sigma = 1.35, 0.56 , 0.68

N = 400
x,y,z = get_correlated_dataset(N, corr, mu, sigma)
data = np.transpose([ x,y,z ])

# 2. Setup and map surfaces .........................................
rez = 3
plane = s3d.PlanarSurface(rez,     name='Planar')
polar = s3d.PolarSurface(rez,      name='Polar')
cylnd = s3d.CylindricalSurface(rez,name='Cylindrical').transform(s3d.eulerRot(90,90))
spher = s3d.SphericalSurface(rez,  name='Spherical')
surfaces = [ plane, polar, cylnd, spher]

# 3. Construct figures, add surfaces, and plot .......................
minmax,ticks = [-3,3],[-3,-1.5,0,1.5,3]
fig = plt.figure(figsize=(6,6))
for i,surface in enumerate(surfaces) :
    ax = fig.add_subplot(221+i, projection='3d')
    ax.set(xlim=minmax, ylim=minmax, zlim=minmax,
           xticks=ticks, yticks=ticks, zticks=ticks )
    ax.tick_params(labelcolor='w')
    ax.set_xlabel('X', labelpad=-12)
    ax.set_ylabel('Y', labelpad=-12)
    ax.set_zlabel('Z', labelpad=-12)
    ax.view_init(30,30)
    ax.scatter(x,y,z, s=8, lw=.5, edgecolor='k')
    ax.set_title(surface.name)
    surface.set_color('C1')
    surface.set_surface_alpha(0.2).evert()
    surface.map_geom_from_svd(data,0.95)
    ax.add_collection3d(surface.get_transformAxis(width=1.5,negaxis=True))
    ax.add_collection(surface.shade())

fig.tight_layout()
plt.show()