Principal Components Analysis
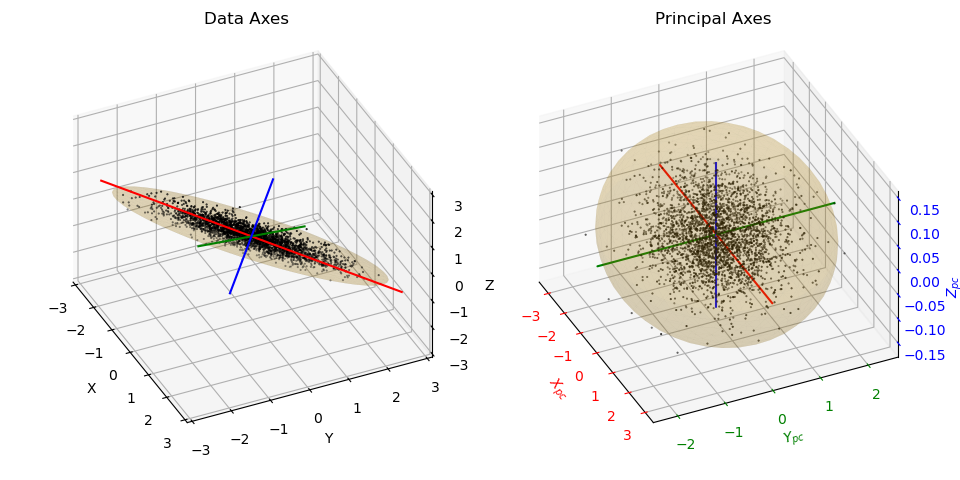
This example is similar to the example scikit-learn Principal components analysis (PCA) . The red, green and blue axes represent the principal component axes. For clarity in the plot, the number data points, N, is 3000 versus 30000 as in the sckit-learn plot, and the axes are scaled.

import numpy as np
import matplotlib.pyplot as plt
from matplotlib import cm
import s3dlib.surface as s3d

#.. Principal components analysis (PCA)

# 1. Define data to examine .........................................

np.random.seed(0)
N=3000
y = np.random.normal(scale=0.5, size=N)
x = np.random.normal(scale=0.5, size=N)
z = np.random.normal(scale=0.1, size=N)
a = x + y
b = 2 * y
c = a - b + z
norm = np.sqrt(a.var() + b.var())
a /= norm
b /= norm
data = np.transpose([ a,b,c ])

# 2. Setup and map surfaces .........................................

ellipsoid = s3d.SphericalSurface(3, color='darkgoldenrod', linewidth=0  )
plate     = s3d.PlanarSurface(3, color='darkgoldenrod', linewidth=0  )

# 3. Construct figures, add surfaces, and plot ......................
surfaces = [ plate, ellipsoid ]
elevazim = [ (-40,-80), (30,20) ]

fig = plt.figure(figsize=plt.figaspect(.5))
minmax,ticks=(-3,3),(-3,-2,-1,0,1,2,3)
for i in range(2) :
    surface = surfaces[i]
    ea = elevazim[i]
    # setup surfaces .......
    surface.map_geom_from_svd(data)
    tAxis = surface.get_transformAxis(lenmult=[2.3,2.5,-20])
    surface.transform(scale=2).set_surface_alpha(.2)
    # .....................
    ax = fig.add_subplot(121+i, projection='3d', aspect='equal')
    ax.set( xlim=minmax, xticks=ticks, xlabel='X',
            ylim=minmax, yticks=ticks, ylabel='Y',
            zlim=minmax, zticks=ticks, zlabel='Z' )
    ax.scatter(a,b,c, c='k', marker='.', s=1)
    ax.view_init(*ea)
    ax.add_collection(surface)
    ax.add_collection3d(tAxis)

fig.tight_layout(pad=2.5)

plt.show()
Alternative view of data in the principal component axes as:

import numpy as np
import matplotlib.pyplot as plt
from matplotlib import cm
import s3dlib.surface as s3d
import copy

#.. Principal components axis plot (PCA)

# 1. Define data to examine .........................................

np.random.seed(0)
N=3000
y = np.random.normal(scale=0.5, size=N)
x = np.random.normal(scale=0.5, size=N)
z = np.random.normal(scale=0.1, size=N)
a = x + y
b = 2 * y
c = a - b + z
norm = np.sqrt(a.var() + b.var())
a /= norm
b /= norm
data = np.transpose([ a,b,c ])

# 2. Setup and map surfaces .........................................

ellipsoid = s3d.SphericalSurface(3, color='darkgoldenrod' )
ellipsoid.set_surface_alpha(.15)
ellipsoid.map_geom_from_svd(data)
tAxis =  ellipsoid.get_transformAxis(lenmult=[2.3,2.5,-20],negaxis=True)
matrix = ellipsoid.svd_dict['trans'][0]
ellipsoid.transform(scale=2)
x,y,z = data.T

transEllp = copy.copy(ellipsoid).transform(matrix.T)
xp,yp,zp = np.dot(data,matrix.T).T

# 3. Construct figures, add surfaces, and plot ......................

minmax,ticks,elaz = (-3,3),(-3,-2,-1,0,1,2,3), (35,-25)
fig = plt.figure(figsize=plt.figaspect(.5))

ax1 = fig.add_subplot(121, projection='3d')
ax1.set_title("Data Axes")
ax1.set( xlim=minmax, xticks=ticks, xlabel='X',
        ylim=minmax, yticks=ticks, ylabel='Y',
        zlim=minmax, zticks=ticks, zlabel='Z' )
ax1.view_init(*elaz)
ax1.set_proj_type('ortho')
ax1.add_collection3d(tAxis)
ax1.scatter(x,y,z, c='k', marker='.', s=1)
ax1.add_collection3d(ellipsoid.shade(0.7))

ax2 = fig.add_subplot(122, projection='3d')
ax2.set_title("Principal Axes")
ax2.set( xlim=[np.min(xp),np.max(xp)],
        ylim=[np.min(yp),np.max(yp)],
        zlim=[np.min(zp),np.max(zp)]  )
ax2.tick_params("x",  colors='r')
ax2.set_xlabel(r'$X_{pc}$', color='r')
ax2.tick_params("y",  colors='g')
ax2.set_ylabel(r'$Y_{pc}$', color='g')
ax2.tick_params("z",  colors='b')
ax2.set_zlabel(r'$Z_{pc}$', color='b')
ax2.view_init(*elaz)
ax2.set_proj_type('ortho')
s3d.setupAxis(ax2, length=[3.5,2.5,.15], width=1.5, negaxis=True,
                  alr=0, color=['r','g','b'], labels='' )
ax2.scatter(xp,yp,zp, c='k', marker='.', s=1)
ax2.add_collection3d(transEllp.shade(0.7))

fig.tight_layout(pad=2)
plt.show()
