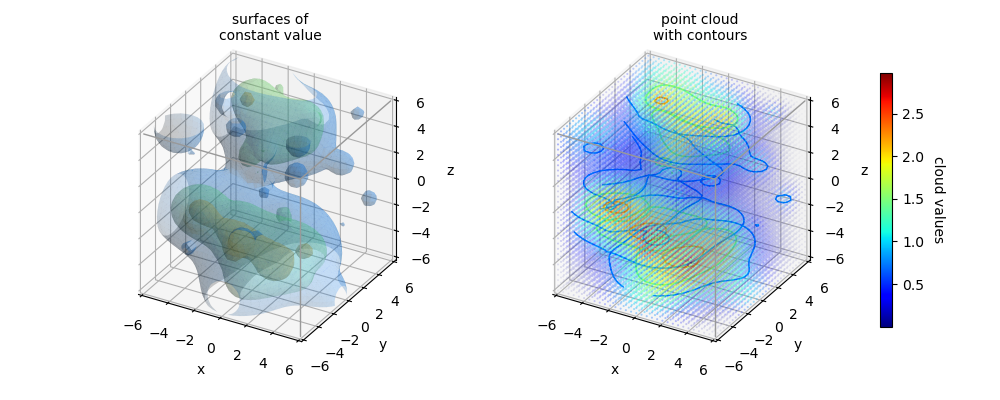
import numpy as np
import matplotlib.pyplot as plt
from matplotlib import cm,colors
import s3dlib.surface as s3d

from example_data import rand_point_cloud

# 1. Get data to examine ...........................................

cloud, minc, maxc, __, __ = rand_point_cloud(50,seed=6)
domain,cmap = [-6,6], 'jet'
xyz, colors_a, __ = s3d.get_points_from_cloud(cloud,domain,cmap,0.5)

# 2. Setup and map surface .........................................

surface = s3d.Surface3DCollection.cloudsurfSet(cloud,domain,3,cmap=cmap)
contours = surface.contourLineSet(6,direction=[0,0,1],coor='p')
contours.set_linewidth(1)
surface.evert().set_surface_alpha(.2)

vE,iE = [ [-6,-6,6], [6,-6,6], [6,6,6], [6,-6,-6] ], [ [0,1,2],[1,3]]

# 3. Construct figures, add surfaces, and plot ....................
fig = plt.figure(figsize=(10,4))
# ....................
fig.text(.27,0.9,'surfaces of\nconstant value',ha='center')
ax_surf = fig.add_subplot(121, projection='3d', aspect='equal',proj_type='ortho')
ax_surf.set(xlim=domain, ylim=domain, zlim=domain,
    xlabel='x',ylabel='y',zlabel='z')
ax_surf.add_collection3d(surface.shade())
ax_surf.add_collection3d( s3d.ColorLine3DCollection(vE,iE,color='0.6',lw=1) )
# ....................
fig.text(.7,0.9,"point cloud\nwith contours",ha='center')
ax_pnts = fig.add_subplot(122, projection='3d', aspect='equal',proj_type='ortho')
ax_pnts.set(xlim=domain, ylim=domain, zlim=domain,
    xlabel='x',ylabel='y',zlabel='z')
ax_pnts.scatter(*xyz, c=colors_a, marker='.', s=1)
ax_pnts.add_collection3d(contours)
ax_pnts.add_collection3d( s3d.ColorLine3DCollection(vE,iE,color='0.6',lw=1) )
# ....................
norm = colors.Normalize(np.min(cloud),np.max(cloud) )
scmp = cm.ScalarMappable(norm=norm,cmap=cmap)
cbar = plt.colorbar(scmp, ax=ax_pnts,  shrink=0.8, pad=.1 )
cbar.set_label('cloud values', rotation=270, labelpad = 15)

fig.tight_layout(pad=3)
plt.show()

