Point Cloud Surface

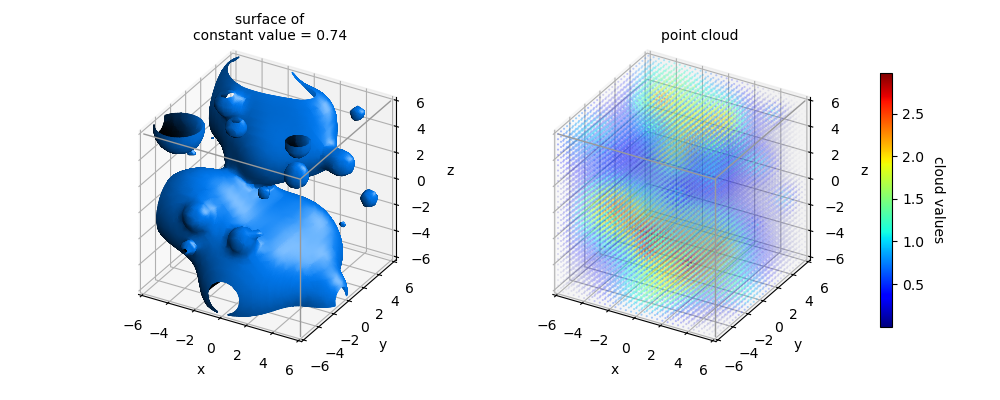
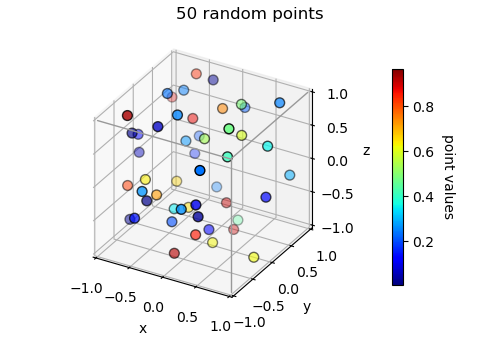
Surfaces of constant value within the point cloud use the cloudsurf static method of the Surface3DCollection class. In the above example, the point cloud is generated with the rand_point_cloud function, which is listed at the end. The function smoothes a set of random points, in this case shown below:

import numpy as np
import matplotlib.pyplot as plt
from matplotlib import cm,colors,colormaps
import s3dlib.surface as s3d

from example_data import rand_point_cloud

# 1. Get data to examine ...........................................

cloud, minc, maxc, __, __ = rand_point_cloud(50,seed=6)
domain,cmap = [-6,6], 'jet'
xyz, colors_a, __ = s3d.get_points_from_cloud(cloud,domain,cmap,0.5)

# 2. Setup and map surface .........................................

level = 0.25
value = minc + (maxc-minc)*level
color = colormaps[cmap](level)
surface = s3d.Surface3DCollection.cloudsurf(cloud,domain,value,color=color)
surface.evert().triangulate(2)

vE,iE = [ [-6,-6,6], [6,-6,6], [6,6,6], [6,-6,-6] ], [ [0,1,2],[1,3]]

# 3. Construct figures, add surfaces, and plot ....................
fig = plt.figure(figsize=(10,4))
# ....................
title = 'surface of\nconstant value = {:.2f}'.format(value)
fig.text(.27,0.9,title,ha='center')
ax_surf = fig.add_subplot(121, projection='3d', aspect='equal',proj_type='ortho')
ax_surf.set(xlim=domain, ylim=domain, zlim=domain,
    xlabel='x',ylabel='y',zlabel='z')
ax_surf.add_collection3d(surface.shade(flat=False).hilite(.5,focus=2,flat=False))
ax_surf.add_collection3d( s3d.ColorLine3DCollection(vE,iE,color='0.6',lw=1) )
# ....................
fig.text(.7,0.9,"point cloud",ha='center')
ax_pnts = fig.add_subplot(122, projection='3d', aspect='equal',proj_type='ortho')
ax_pnts.set(xlim=domain, ylim=domain, zlim=domain,
    xlabel='x',ylabel='y',zlabel='z')
ax_pnts.scatter(*xyz, c=colors_a, marker='.', s=1)
ax_pnts.add_collection3d( s3d.ColorLine3DCollection(vE,iE,color='0.6',lw=1) )
# ....................
norm = colors.Normalize(np.min(cloud),np.max(cloud) )
scmp = cm.ScalarMappable(norm=norm,cmap=cmap)
cbar = plt.colorbar(scmp, ax=ax_pnts,  shrink=0.8, pad=.1 )
cbar.set_label('cloud values', rotation=270, labelpad = 15)

fig.tight_layout(pad=3)
plt.show()
The random points and values used for the point cloud are accessed by:
The points were used for a Matplotlib scatter plot, along with the values for the color bar:
The rand_point_cloud function to create the point cloud from random points is:
import numpy as np

def rand_point_cloud(nPoints=50, N=None, spred=None, seed=None) :
    if seed is not None : np.random.seed(seed)
    N = 30 if N is None else N
    spred = 4 if spred is None else spred
    Nj = (N+1)*1j
    xyz = np.mgrid[-1:1:Nj,-1:1:Nj, -1:1:Nj ]
    rvals = np.random.rand(4,nPoints)
    bxyz = ( 1-2*rvals[:3].T )
    Ro = rvals[3::][0]
    dens = np.zeros(xyz.T.shape[:3])
    A = -0.223*spred**2
    for i,org in enumerate(bxyz) :
        diff = (xyz.T - org)
        R = np.linalg.norm(diff,axis=3)
        dens = dens + np.exp(A*(R/Ro[i])**2)
    return dens.T, np.min(dens), np.max(dens), bxyz, Ro
