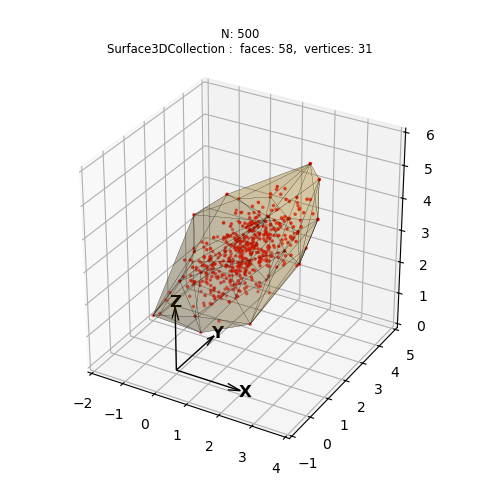
import numpy as np
import matplotlib.pyplot as plt
import s3dlib.surface as s3d

#.. Convex Hull Visualization

# 1. Define data to examine .........................................

N = 500
np.random.seed(0)

def get_correlated_dataset(n, dependency, mu, scale):
    latent = np.random.randn(n, 3)
    dependent = latent.dot(dependency)
    scaled = dependent * scale
    scaled_with_offset = scaled + mu
    # return x y z of the new, correlated dataset
    return scaled_with_offset[:, 0], scaled_with_offset[:, 1], scaled_with_offset[:, 2]

corr = np.array([ [0.85, 0.35, 0.4], [0.15, -0.65, 0.6], [0.3, 0.7, 1.0] ])
mu = 1,2,3
sigma = .8,.5 , .7
x,y,z = get_correlated_dataset(N, corr, mu, sigma)
data = np.transpose([ x,y,z ])

# 2. Setup and map surfaces .........................................
surface = s3d.Surface3DCollection.chull(data,color='goldenrod')
surface.set_surface_alpha(.2).shade()
surface.set_edgecolor('k')
surface.set_linewidth(.1)

info = "N: "+str(N) + "\n"+ str(surface)

# 3. Construct figures, add surfaces, and plot .......................

fig = plt.figure(figsize=plt.figaspect(1))
ax = plt.axes(projection='3d', aspect='equal')
ax.set(xlim=(-2,4), ylim=(-1,5), zlim=(0,6) )
ax.set_title(info, fontsize='small')
s3d.setupAxis(ax, length=2, width=1, negaxis=False )

ax.scatter(x,y,z,c='r', marker='.', s=10)
ax.add_collection3d(surface)

fig.tight_layout(pad=2)
plt.show()


