
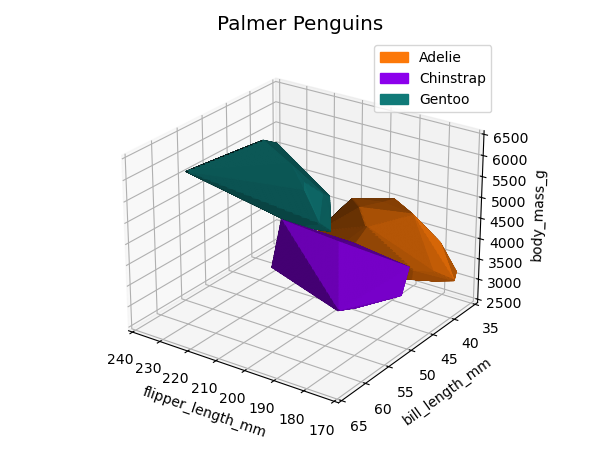
Penguin Data-set Convex Hull
Data is from the PalmerPenguin dataset created by Dr. Kristen Gorman and the Palmer Station, Antarctica LTER.
import csv
import numpy as np
import matplotlib.pyplot as plt
import matplotlib.patches as mpatches
import s3dlib.surface as s3d

#.. Penguin Data-set Convex Hull

# 1. Define data to examine .........................................

with open('data/palmerpenguins.csv') as csv_file:
    csv_reader = csv.reader(csv_file, delimiter=',')
    line_count = 0
    all_data = []
    for row in csv_reader:
        line_count += 1
        if line_count ==1 :
            heading = row
        else:  all_data.append(row)
heading = heading[2:6]
nptemp = np.array(all_data)[:,2:6].T.astype(float)
pgtype = np.array(all_data)[:,0]
x,y,z = 2,0,3    #.. fields to be plotted
X = np.array(  [ nptemp[x],  nptemp[y], nptemp[z] ] )

# 2 & 3. Setup surfaces and plot ....................................

rgbC = [ [0.988,0.471,0.031], [0.549,0.000,0.925], [0.063,0.478,0.471] ]
names = [ 'Adelie', 'Chinstrap', 'Gentoo' ]
handles = [None]*3

fig = plt.figure(figsize=(6, 4.5))
ax = plt.axes(projection='3d')
ax.set( xlim=(170,240), ylim=(35,65),zlim=(2500,6500),
        xlabel=heading[x], ylabel=heading[y], zlabel=heading[z]  )

for i in range(3) :
    data = X.T[pgtype == names[i]]
    colors = [rgbC[i]]
    dataT = data.T
    handles[i] = mpatches.Patch(color=rgbC[i], label=names[i])
    # .........................................
    surface = s3d.Surface3DCollection.chull(data,color=rgbC[i])
    surface.evert().triangulate(4)
    surface.shade()
    # .........................................
    ax.add_collection3d(surface)

ax.legend(handles=handles)
ax.set_title('Palmer Penguins', fontsize='x-large' )
ax.view_init(elev=25, azim=125)
fig.tight_layout()
plt.show()