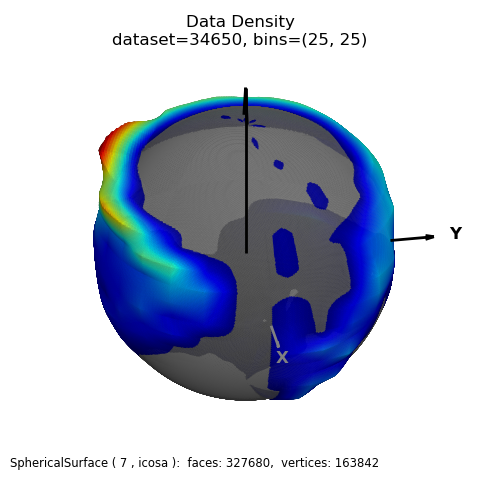
(θ,φ) Dataset Density

This example uses the method of data generation as the (x,y) Dataset Density example. In this case, the x,y dataset is used as a (θ,φ) dataset. The density is appropriately plotted in spherical coordinates using the radial distance as an indicator of the data density.
The following colormap was used to indicate density values, with semi-transparency showing minimums.

import numpy as np
import matplotlib.pyplot as plt
import s3dlib.surface as s3d
from matplotlib import cm,colormaps
from matplotlib.colors import ListedColormap

#.. Data density figures .....

# 1. generate a x,y dataset and function to examine .................
bns = (25,25)

surface = s3d.SphericalSurface.grid(5*20,7*25)
surface.map_geom_from_op(lambda c: [2+np.sin(7*c[1]+5*c[2]),c[1],c[2]] )
data = np.array(surface.area_h2b)  # ................... dataset [x,y]
scale = 1
f = s3d.density_function(data,bins=bns, scale=scale)  # returns density = f(x,y)

def surfDist(rtp):
    r,t,p = rtp
    x,y = t/np.pi, p/np.pi
    R = r + 0.2*f(x,y)/400   # ... use density function
    return R,t,p

# 2. Setup and map surfaces .........................................
rez,cmap = 7, colormaps['jet']
grbase = cmap(np.linspace(0,1,256))
grbase[0:5:] = [.5,.5,.5,.5]
grbase = ListedColormap(grbase)

surface = s3d.SphericalSurface(rez,cmap=grbase,lw=0.1)
surface.map_geom_from_op(surfDist)
surface.map_cmap_from_op(lambda c: c[0])

# 3. Construct figure, add surface, plot ............................
minmax = (-.8,.8)
fig = plt.figure(figsize=plt.figaspect(1))
fig.text(0.02,0.02,str(surface), ha='left', va='bottom', fontsize='smaller')
ax = plt.axes(projection='3d', aspect='equal')
title = "Data Density\ndataset="+ str(len(data[0])) + ', bins='+str(bns)
ax.set_title( title )
ax.set_proj_type('ortho')
zlabel = 'Density X N, bins='+str(bns)
ax.set(xlim=minmax,ylim=minmax,zlim=minmax)
s3d.setupAxis(ax, length=1.3, offset=[1,1,0], width=2,
    negaxis=False, labels=['X','Y',''], color=['.5','k','k'] )
ax.view_init(30,-10)
ax.set_axis_off()
ax.add_collection3d(surface.shade())

fig.tight_layout()
plt.show()
