
(θ,φ) Dataset Density Contours
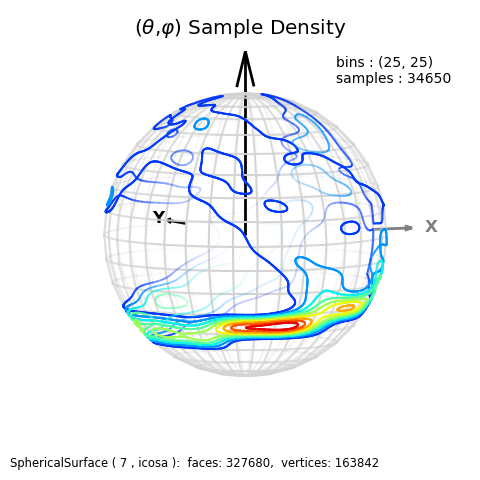
This example uses the method of data generation as the (x,y) Dataset Density example. In this case, the x,y dataset is used as a (θ,φ) dataset. The density is appropriately plotted in spherical coordinates using the radial distance as an indicator of the data density.
import numpy as np
import matplotlib.pyplot as plt
import s3dlib.surface as s3d
from matplotlib import cm,colormaps,colors

# 1. generate a x,y dataset and function to examine .................
bns = (25,25)

surface = s3d.SphericalSurface.grid(5*20,7*25)
surface.map_geom_from_op(lambda c: [2+np.sin(7*c[1]+5*c[2]),c[1],c[2]] )
data = np.array(surface.area_h2b)  # ................... dataset [x,y]
scale = 1
f,dndmn = s3d.density_function(data,bins=bns, scale=scale)

def ftp(t,p) :
    # express f(x,y) as ftp(t,p) = f( x(t), y(p) )
    dx = dndmn[0,1]-dndmn[0,0]
    dy = dndmn[1,1]-dndmn[1,0]
    ymax = dndmn[1,1]
    x = dx*t/(2*np.pi)
    y = ymax - dy*p/np.pi
    return f(x,y)

def surfDist(rtp):
    r,t,p = rtp
    Roff = ftp(t,p)
    rmax = np.max(Roff)
    R = r + 0.35*Roff/rmax
    return R,t,p

# 2. Setup and map surfaces .........................................
rez,cmap,nlng = 7, colormaps['jet'], 18

grbase = cmap(np.linspace(0,1,256))
grbase[0:36:] = [1,1,1,.05]
grbase = colors.ListedColormap(grbase)

surface = s3d.SphericalSurface(rez,cmap=grbase)
surface.map_geom_from_op(surfDist)
surface.map_cmap_from_op(lambda c: c[0])

contours = surface.contourLineSet(10)
contours.map_to_plane(1,coor='s')

grid = s3d.SphericalSurface.grid(nlng,2*nlng,'r',color='lightgrey').edges

# 3. Construct figure, add surface, plot ............................
minmax = (-.8,.8)
fig = plt.figure(figsize=plt.figaspect(1))
fig.text(.5,.94,r"($\theta$,$\varphi$) Sample Density", va='center',ha='center', fontsize='x-large' )
info = 'bins : {}\nsamples : {}'.format(bns,len(data[0]))
fig.text(.7,.82,info,va='bottom',ha='left')
fig.text(0.02,0.02,str(surface), ha='left', va='bottom', fontsize='smaller')
ax = plt.axes(projection='3d', aspect='equal',proj_type='ortho')
ax.set(xlim=minmax,ylim=minmax,zlim=minmax)
s3d.setupAxis(ax, length=1.3, offset=[1,1,0], width=2,
    negaxis=False, labels=['X','Y',''], color=['.5','k','k'] )
ax.view_init(5,-115)
ax.set_axis_off()
#ax.add_collection3d(surface.shade(ax=ax))
ax.add_collection3d(contours.fade(ax=ax))
ax.add_collection3d(grid.fade(ax=ax))

fig.tight_layout(pad=3)
plt.show()