
Percentile Visualization Dataset Surface
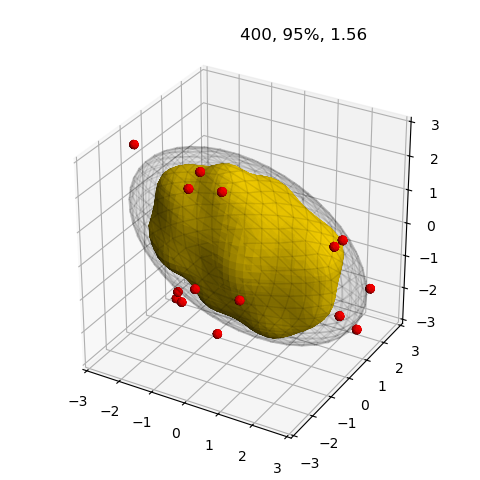
Using the Percentile Visualization example dataset, the above figure shows the 5% of data points outside the ellipsoid and the surface containing the higher density of datapoints.
Note: the datapoints are represented as a collection of SphericalSurface objects using the samples_to_object function.
import numpy as np
import matplotlib.pyplot as plt
import s3dlib.surface as s3d
import s3dlib.pntcloud as ptc

#.. Percentile Visualization Data Surface

# 1. Define data to examine .........................................
np.random.seed(3)

def get_correlated_dataset(n, dependency, mu, scale):
    latent = np.random.randn(n, 3)
    dependent = latent.dot(dependency)
    scaled = dependent * scale
    scaled_with_offset = scaled + mu
    # return x y z of the new, correlated dataset
    return scaled_with_offset[:, 0], scaled_with_offset[:, 1], scaled_with_offset[:, 2]

corr = np.array([ [0.85, -.15, 0.4], [-0.35, -0.65, 0.7], [-.4, 0.6, 1.0] ])
mu = 0,0,0
sigma = 1.35, 0.56 , 0.68
N = 400
x,y,z = get_correlated_dataset(N, corr, mu, sigma)
data = np.transpose([ x,y,z ])

# 2. Setup and map surfaces .........................................
prct = 0.95

surface = s3d.SphericalSurface(3, color=[0,0,0,0.05], linewidth=.5  )
surface.map_geom_from_svd(data, prct)
surface.shade()
info = str(N) +', '+"{:.0%}".format(prct) + ', ' + '{:04.2f}'.format( surface.svd_dict['sigma'] )

subset =      data[ surface.svd_dict['disarr'] < 1.0 ]
outersubset = data[ surface.svd_dict['disarr'] > 1.0 ]

pdg, drez, relden, domain = 2.0,3,0.12, 3

cloudObj = ptc.Point3DCloud(drez,domain=domain, color='gold')
cloudObj.map_vals_from_sampdens(subset,pdg)
subsurface = cloudObj.valsurf(relden)
subsurface.shade()

points = s3d.samples_to_object(outersubset,domain,size=.45)
points.set_color('r')
points.shade()

# 3. Construct figures, add surfaces, and plot .......................

fig = plt.figure(figsize=plt.figaspect(1))
ax = plt.axes(projection='3d',aspect='equal')
ax.set(xlim=[-3,3], ylim=[-3,3], zlim=[-3,3] )
ax.set_title(info, horizontalalignment='left')

ax.add_collection(subsurface+surface+points)

fig.tight_layout(pad=2)
plt.show()