
Penguin Dataset Surface
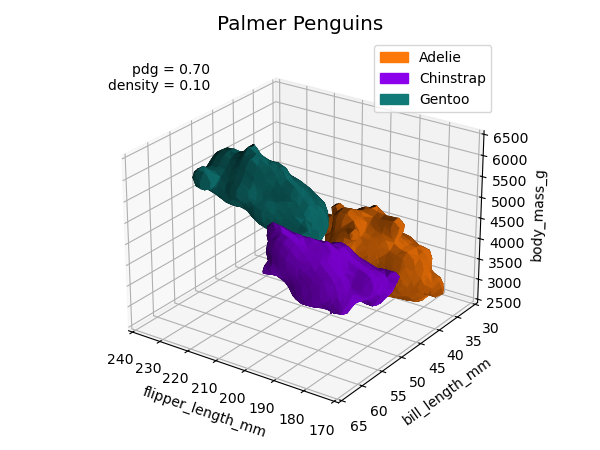
Density data surfaces for the Palmer Penguin Data-set .
import csv
import numpy as np
import matplotlib.pyplot as plt
import matplotlib.patches as mpatches
import s3dlib.surface as s3d
import s3dlib.pntcloud as ptc

#.. Penguin Data-set Surface

# 1. Define data to examine .........................................

with open('data/palmerpenguins.csv') as csv_file:
    csv_reader = csv.reader(csv_file, delimiter=',')
    line_count = 0
    all_data = []
    for row in csv_reader:
        line_count += 1
        if line_count ==1 :
            heading = row
        else:  all_data.append(row)
heading = heading[2:6]
nptemp = np.array(all_data)[:,2:6].T.astype(float)
pgtype = np.array(all_data)[:,0]
x,y,z = 2,0,3    #.. fields to be plotted
X = np.array(  [ nptemp[x],  nptemp[y], nptemp[z] ] )

# 2 & 3. Setup surfaces and plot ....................................

rgbC = [ [0.988,0.471,0.031], [0.549,0.000,0.925], [0.063,0.478,0.471] ]
names = [ 'Adelie', 'Chinstrap', 'Gentoo' ]
handles = [None]*3

pdg, drez, relden = 0.7,3,0.10

domain = [ (170,240),(30,65),(2500,6500) ]
fig = plt.figure(figsize=(6, 4.5))
ax = plt.axes(projection='3d')
ax.set( xlim=domain[0], ylim=domain[1],zlim=domain[2],
        xlabel=heading[x], ylabel=heading[y], zlabel=heading[z]  )

for i in range(3) :
    data = X.T[pgtype == names[i]]
    handles[i] = mpatches.Patch(color=rgbC[i], label=names[i])
    # .........................................
    cloudObj = ptc.Point3DCloud(drez,domain=domain,color=rgbC[i])
    cloudObj.map_vals_from_sampdens(data,pdg)
    surface = cloudObj.valsurf(relden)
    surface.evert().shade()
    # .........................................
    ax.add_collection3d(surface)

ax.legend(handles=handles)
cntlTitle = 'pdg = {:.2f}\ndensity = {:.2f}'.format(pdg,relden)
fig.text(.35,.8,cntlTitle,ha='right',fontsize='medium')
ax.set_title('Palmer Penguins', fontsize='x-large' )
ax.view_init(elev=25, azim=125)
fig.tight_layout()
plt.show()