
Point Surface
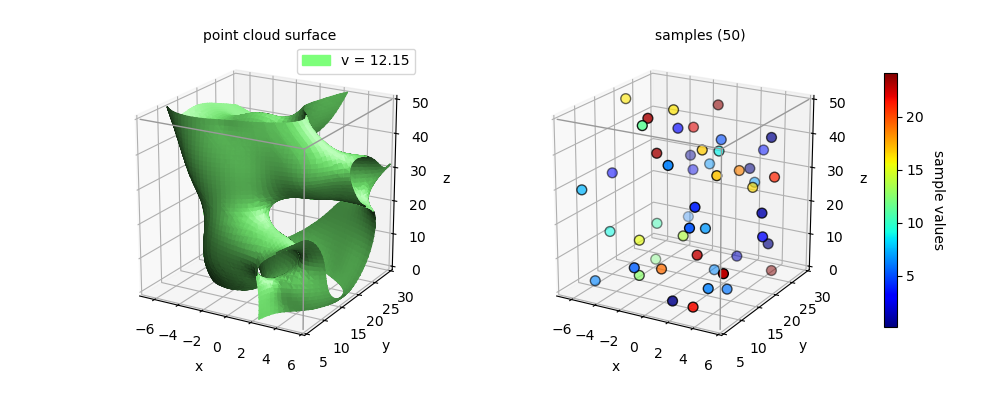
From the unstructured distribution of values within the domain, a point cloud is constructed ( see Cloud Values from Sample Data ). A surface of constant value within the cloud is shown in the above figure.
import numpy as np
import matplotlib.pyplot as plt
from matplotlib import cm,colors,colormaps,patches
import s3dlib.surface as s3d
import s3dlib.pntcloud as ptc

# 1. generate data samples with values ............................
N,seed,val_mult,domain = 50, 6, 25.0, [ [-7,6], [5,30], [0,50] ]
np.random.seed(seed)
xc = np.random.uniform(*domain[0], N)
yc = np.random.uniform(*domain[1], N)
zc = np.random.uniform(*domain[2], N)
dt_coor = np.column_stack((xc,yc,zc))
vals = val_mult*np.random.uniform(size=N)
points = np.column_stack((dt_coor,vals))
vmid = ( np.min(vals) + np.max(vals) )/2

# 2. Setup and map point cloud ....................................
drez,vadj,cmap = 4, 'c', 'jet'

cloudObj = ptc.Point3DCloud(drez,domain=domain)
cloudObj.map_vals_from_sampvals(points,vadj=vadj, cmap=cmap)

surface = cloudObj.valsurf( vmid )

c,_,_ = cloudObj.get_color_for_val([vmid])

# 3. Construct figures, add surfaces, and plot ....................
fig = plt.figure(figsize=(10,4))
# ....................
title = 'point cloud surface'
fig.text(.27,0.9,title,ha='center')
ax = fig.add_subplot(121, projection='3d', aspect='equal')
ax.view_init(20)
ax.set(xlim=domain[0], ylim=domain[1], zlim=domain[2],
    xlabel='x',ylabel='y',zlabel='z')
ax.add_collection3d(surface.shade(ax=ax).hilite(.5,ax=ax))
s3d.add_boxCorner(ax,domain)

patch = patches.Patch(label='v = {:.2f}'.format(vmid), color=c[0] )
ax.legend(handles=[patch])
# ....................
title = 'samples ({})'.format(N)
fig.text(.7,0.9,title,ha='center')
ax = fig.add_subplot(122, projection='3d', aspect='equal')
ax.view_init(20)
ax.set(xlim=domain[0], ylim=domain[1], zlim=domain[2],
    xlabel='x',ylabel='y',zlabel='z')
ax.scatter(*dt_coor.T, s=50, c=vals, cmap=cmap ,edgecolor='k')
s3d.add_boxCorner(ax,domain)

norm = colors.Normalize(np.min(vals),np.max(vals) )
cbar =fig.colorbar(cm.ScalarMappable(norm=norm, cmap=cmap), ax=ax,shrink=0.8, pad=.1)
cbar.set_label('sample values', rotation=270, labelpad = 15)
# ....................

fig.tight_layout(pad=3)
plt.show()