
Cloud Coordinate Array with Values
( x, y, z, w )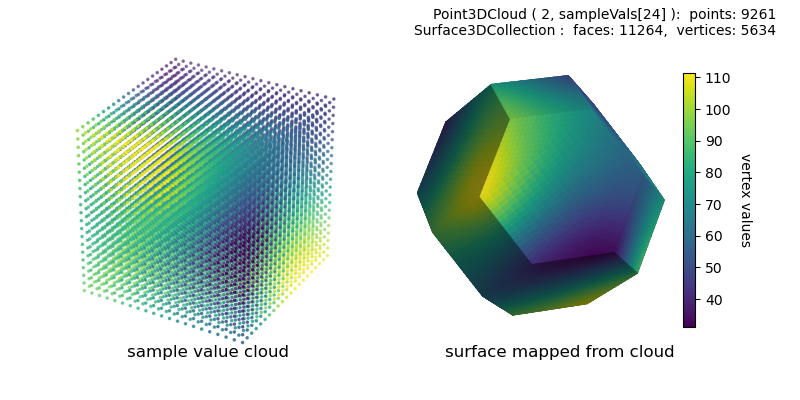
This example is similar to the Vertex Coordinate Array with Values example , but in this case, the input vertex values are used as valued sample to create a cloud. The cloud is then used to set the surface vertex and color values.
import numpy as np
import matplotlib.pyplot as plt
import s3dlib.surface as s3d
import s3dlib.pntcloud as ptc

# 1. Define truncated octahedron geometry with values .............
a = 0.5
v = [
    [ a, 0, 1, 71], [ 0, a, 1, 49], [-a, 0, 1, 78], [ 0,-a, 1, 97],
    [ 1, 0, a, 56], [ 0, 1, a, 56], [-1, 0, a, 42], [ 0,-1, a,112],
    [ 1, a, 0, 77], [ a, 1, 0, 66], [-a, 1, 0, 92], [-1, a, 0, 31],
    [-1,-a, 0, 63], [-a,-1, 0, 92], [ a,-1, 0, 43], [ 1,-a, 0, 34],
    [ 1, 0,-a, 89], [ 0, 1,-a,103], [-1, 0,-a, 85], [ 0,-1,-a, 60],
    [ a, 0,-1,109], [ 0, a,-1, 91], [-a, 0,-1,101], [ 0,-a,-1, 94]
]
f4 = [
    [ 0, 1, 2, 3],
    [ 4,15,16, 8], [5,9,17,10], [6,11,18,12], [ 7,13,19,14],
    [20,23,22,21]
]
f6 = [
    [ 4, 8, 9, 5, 1, 0], [ 5,10,11, 6, 2, 1], [ 6,12,13, 7, 3, 2], [ 7,14,15, 4, 0, 3],
    [16,20,21,17, 9, 8], [17,21,22,18,11,10], [18,22,23,19,13,12], [19,23,20,16,15,14]
]
f = f4 + f6

# 2. Setup and map surfaces .......................................
drez,cmap,domain= 2, 'viridis',[ [-1,1], [-1,1], [-1,1] ]

cloudObj = ptc.Point3DCloud(drez,domain=domain)
cloudObj.map_vals_from_sampvals(v ,vadj='c',dreset=True,cmap=cmap)

surface = s3d.Surface3DCollection(v, f, cmap=cmap)
surface.triangulate(4)
surface.map_vertvals_from_cloud(cloudObj)

# Construct figure, add surface, plot .............................
title = ['sample value cloud', 'surface mapped from cloud']
fig = plt.figure(figsize=(8,4))
ftext = str(cloudObj) + '\n' + str(surface)
fig.text(0.97,0.98,ftext, ha='right', va='top', fontsize='medium')
for i in range(2) :
    ax =fig.add_subplot(121+i, projection='3d', aspect='equal')
    ofst = 0.26 if i==0 else 0.7
    fig.text(ofst,0.1,title[i], ha='center', va='bottom', fontsize='large')
    ax.set_axis_off()
    minmax = [-1,1]if i==0 else (-.67,.67)  # Note: adjust for colorbar
    ax.set(xlim=minmax, ylim=minmax, zlim=minmax)
    if i==0 :
        cloudObj.add_to3d(ax)
    else :
        ax.add_collection3d(surface.shade())

cbar = plt.colorbar(surface.cBar_ScalarMappable, ax=ax,  shrink=0.8 )
cbar.set_label('vertex values', rotation=270, labelpad=15)

fig.tight_layout(pad=3)
plt.show()