
Vertex Coordinate Array with Values
( x, y, z, w )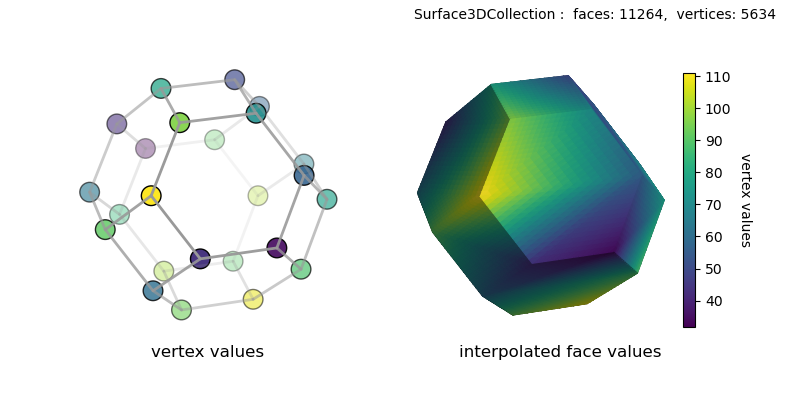
This example is similar to the Cloud Coordinate Array with Values example , but in this case, the input vertex values are used to colormap the triangulated faces.
The vertex coordinates are the same as the Truncated Octahedron Edges example with the addition of scalar values included to each vertex coordinate.
import numpy as np
import matplotlib.pyplot as plt
import s3dlib.surface as s3d

# 1. Define truncated octahedron geometry with values .............
a = 0.5
v = [
    [ a, 0, 1, 71], [ 0, a, 1, 49], [-a, 0, 1, 78], [ 0,-a, 1, 97],
    [ 1, 0, a, 56], [ 0, 1, a, 56], [-1, 0, a, 42], [ 0,-1, a,112],
    [ 1, a, 0, 77], [ a, 1, 0, 66], [-a, 1, 0, 92], [-1, a, 0, 31],
    [-1,-a, 0, 63], [-a,-1, 0, 92], [ a,-1, 0, 43], [ 1,-a, 0, 34],
    [ 1, 0,-a, 89], [ 0, 1,-a,103], [-1, 0,-a, 85], [ 0,-1,-a, 60],
    [ a, 0,-1,109], [ 0, a,-1, 91], [-a, 0,-1,101], [ 0,-a,-1, 94]
]
f4 = [
    [ 0, 1, 2, 3],
    [ 4,15,16, 8], [5,9,17,10], [6,11,18,12], [ 7,13,19,14],
    [20,23,22,21]
]
f6 = [
    [ 4, 8, 9, 5, 1, 0], [ 5,10,11, 6, 2, 1], [ 6,12,13, 7, 3, 2], [ 7,14,15, 4, 0, 3],
    [16,20,21,17, 9, 8], [17,21,22,18,11,10], [18,22,23,19,13,12], [19,23,20,16,15,14]
]
f = f4 + f6

# 2. Setup and map surfaces .......................................
cmap = 'viridis'

surface = s3d.Surface3DCollection(v, f, cmap=cmap)
vertices = surface.vertices
surface.triangulate(4)
surface.map_cmap_from_vertvals()

edges = surface.initedges
edges.set_color('.6')
edges.set_linewidth(2)

# Construct figure, add surface, plot .............................
title = ['vertex values', 'interpolated face values']
fig = plt.figure(figsize=(8,4))
fig.text(0.97,0.98,str(surface), ha='right', va='top', fontsize='medium')
for i in range(2) :
    ax =fig.add_subplot(121+i, projection='3d', aspect='equal')
    ofst = 0.26 if i==0 else 0.7
    fig.text(ofst,0.1,title[i], ha='center', va='bottom', fontsize='large')
    ax.set_axis_off()
    minmax = (-.85,.85) if i==0 else (-.67,.67)  # Note: adjust for colorbar
    ax.set(xlim=minmax, ylim=minmax, zlim=minmax)
    if i==0 :
        ax.scatter(*vertices, c=np.array(v).T[3], cmap=cmap, s=200,edgecolor='k')
        ax.add_collection3d(edges.fade(.1))
    else :
        ax.add_collection3d(surface.shade())

cbar = plt.colorbar(surface.cBar_ScalarMappable, ax=ax,  shrink=0.8 )
cbar.set_label('vertex values', rotation=270, labelpad=15)

fig.tight_layout(pad=3)
plt.show()