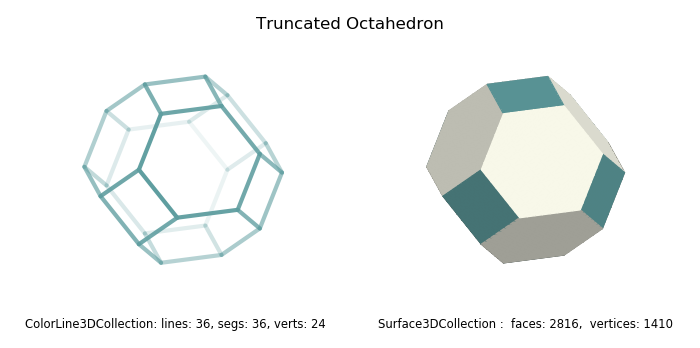
Truncated Octahedron Edges

As discussed in the Base Class Surface 2 example, input surfaces with faces not having the same number of face edges in the collection will be triangulated. To show the initial input face edges, surfaces for this case have the property:
edges = surface.initedges
Using this property, the above left figure of edges is displayed, even though the actual surface faces are triangulate (highlighted line).
Note
The intedges property is not defined for surfaces initiatted with faces which have the same number of edges within the collection.
In this example, the surface is further triangulated to eliminate a small rendering anomaly resulting from the overlapping of large surfaces, which is discussed in the Line Filled Surfaces guides.
import numpy as np
import matplotlib.pyplot as plt
import s3dlib.surface as s3d

#.. Truncated Octahedron

# 1. Define truncated octahedron  geometry ...........................

a = 0.5

v = [
    [ a, 0, 1], [ 0, a, 1], [-a, 0, 1], [ 0,-a, 1],
    [ 1, 0, a], [ 0, 1, a], [-1, 0, a], [ 0,-1, a],
    [ 1, a, 0], [ a, 1, 0], [-a, 1, 0], [-1, a, 0],
    [-1,-a, 0], [-a,-1, 0], [ a,-1, 0], [ 1,-a, 0],
    [ 1, 0,-a], [ 0, 1,-a], [-1, 0,-a], [ 0,-1,-a],
    [ a, 0,-1], [ 0, a,-1], [-a, 0,-1], [ 0,-a,-1]
]

f4 = [
    [ 0, 1, 2, 3],
    [ 4,15,16, 8], [5,9,17,10], [6,11,18,12], [ 7,13,19,14],
    [20,23,22,21]
]
f6 = [
    [ 4, 8, 9, 5, 1, 0], [ 5,10,11, 6, 2, 1], [ 6,12,13, 7, 3, 2], [ 7,14,15, 4, 0, 3],
    [16,20,21,17, 9, 8], [17,21,22,18,11,10], [18,22,23,19,13,12], [19,23,20,16,15,14]
]

f = f4 + f6
colors = ['cadetblue']*6 + ['ivory']*8

# 2. Setup and map surfaces .........................................

surface = s3d.Surface3DCollection(v, f, name='Truncated Octahedron', color=colors)
surface.triangulate(3)
surface.shade(0.25,[1,-.5,1.5])

edges = surface.initedges
edges.set_color('cadetblue')
edges.set_linewidth(3)
edges.fade(0.1)

objects =[ edges, surface]

# 3. Construct figure, add surface, and plot ......................

minmax = (-1.0,1.0)
fig = plt.figure(figsize=(7,3.5))
fig.text(0.5,0.95,surface.name, ha='center', va='top', fontsize='larger')
for i in range(len(objects)) :
    fig.text(0.25+0.5*i,0.05,str(objects[i]), ha='center', va='bottom',fontsize='small')
    ax =fig.add_subplot(121+i, projection='3d', aspect='equal')
    ax.set(xlim=minmax, ylim=minmax, zlim=minmax)
    ax.set_axis_off()
    ax.set_proj_type('ortho')

    ax.add_collection3d(objects[i])

fig.tight_layout(pad=1)

plt.show()
