Vertex Value Assignment to a Mesh

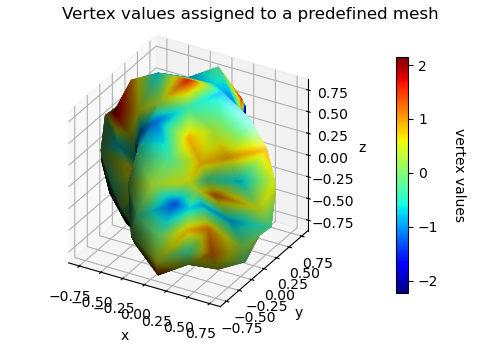
This example demonstrates assigning vertex values to a surface object.
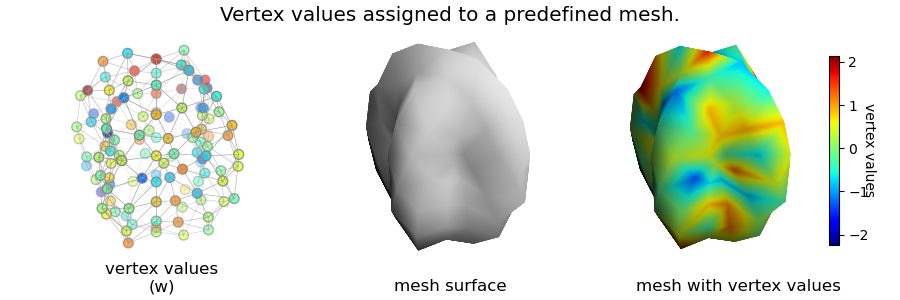
The values of all surface vertices are set using the object method set_vertvals and set prior to surface triangulation. The length of values array must be the equal to the number of surface vertices. Once triangulated, colors are mapped over the triangulated flat surfaces using the the method map_cmap_from_vertvals. The separate structure of the above plot can be illustrated as shown below:

import numpy as np
import matplotlib.pyplot as plt
import s3dlib.surface as s3d
import copy

# 1. Define geometry to examine ......................................
def deflate(rtp) :
    r,t,p = rtp
    scale = 0.3
    Rz = np.cos(p)
    Rxys = (1-scale)*np.sin(p) + scale*np.cos(4*t)
    R = np.sqrt( Rz**2 + Rxys**2)
    return R,t,p

# 2. Setup and map surfaces .........................................
rez,btype,trez,seed,cmap = 1, 'dodeca', 4, 1, 'jet'

surface = s3d.SphericalSurface(rez,btype, color='.9')
surface.map_geom_from_op(deflate)
edges    = surface.edges
edges.set_linewidth(.5)
edges.set_color('0.6')
vertices = surface.vertices
# assign random vertex values.
numVerts = len(vertices.T)
np.random.seed(seed)
w = np.random.normal(0, 1, numVerts)
surface.set_vertvals(w)
# setup surfaces to be plotted.
surface.triangulate(trez)
surfacev = copy.copy(surface)
surfacev.map_cmap_from_vertvals(cmap)

# 3. Construct figure, add surface, plot ............................
figTitle = 'Vertex values assigned to a predefined mesh.'
title = ['vertex values\n(w)', 'mesh surface', 'mesh with vertex values']
ofst = [0.18,0.5,0.82]
fig = plt.figure(figsize=(9,3))
fig.text(0.5,0.98,figTitle, ha='center', va='top', fontsize='x-large')
for i in range(3) :
    ax =fig.add_subplot(131+i, projection='3d', aspect='equal')
    fig.text(ofst[i],0.02,title[i], ha='center', va='bottom', fontsize='large')
    ax.set_axis_off()
    if i==0 :
        ax.add_collection3d(edges.fade(.1))
        ax.scatter(*vertices, c=w, cmap=cmap, s=50,edgecolor='0.5')
    elif i==1 :
        ax.add_collection3d(surface.shade(flat=False))
    else :
        ax.add_collection3d(surfacev.shade(flat=False))
    usc = .72 if i<=1 else 0.6  # compensate for colorbar space.
    s3d.auto_scale(ax,surface,uscale=usc)

cbar = plt.colorbar(surfacev.cBar_ScalarMappable, ax=ax,  shrink=0.7 )
cbar.set_label('vertex values', rotation=270, labelpad=5)

fig.tight_layout()
plt.show()
