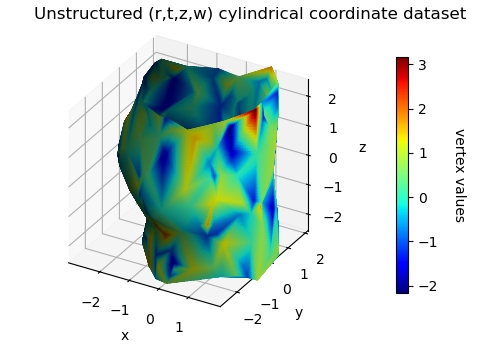
Unstructured Cylindrical Dataset

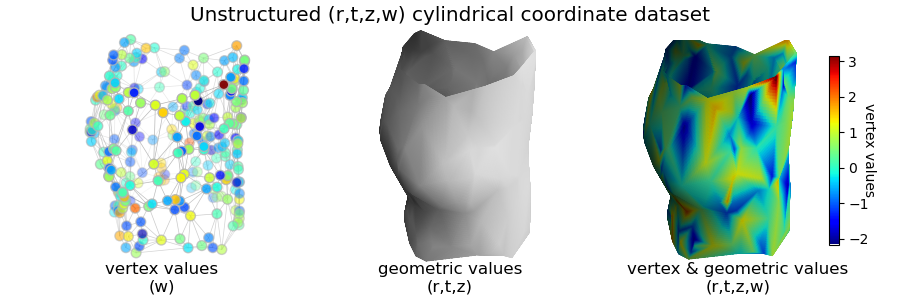
This example is similar to the Unstructured Spherical and Cylindrical Coordinates example with the addition of scalar values assigned to each vertex. The separate structure of the above plot can be illustrated as shown below:

import numpy as np
import matplotlib.pyplot as plt
import s3dlib.surface as s3d
import copy

# 1. Create dataset to examine ......................................
# make data:  <--- copy from matplotlib examples
np.random.seed(3)
x = np.random.uniform(-3, 3, 256)
y = np.random.uniform(-3, 3, 256)
z = (1 - x/2 + x**5 + y**3) * np.exp(-x**2 - y**2)
w = np.random.normal(0, 1, 256)  # <-- include vertex values

# transform to a cylindrical dataset, (r,t,z)
t = (x/3 +1)*np.pi
Z = y
r = z + 2   # <-- shift the radius
rtz = np.array([r,t,Z])
rtzw = np.array([r,t,Z,w])
xyz = s3d.CylindricalSurface.coor_convert(rtz,True)  # <-- for scatter plot

# 2. Setup and map surfaces .........................................
cmap = 'jet'
surface = s3d.CylindricalSurface.pntsurf(rtzw.T,color='w')
# setup scatter plot unstructured mesh.
edges    = surface.edges
edges.set_linewidth(.5)
edges.set_color('0.7')
vertices = surface.vertices
# setup surfaces to be plotted.
surface.triangulate(4)
surfacev = copy.copy(surface)
surfacev.map_cmap_from_vertvals(cmap)

# 3. Construct figure, add surface, plot ............................
figTitle = 'Unstructured (r,t,z,w) cylindrical coordinate dataset'
title = ['vertex values\n(w)', 'geometric values\n(r,t,z)', 'vertex & geometric values\n(r,t,z,w)']
ofst = [0.18,0.5,0.82]
fig = plt.figure(figsize=(9,3))
fig.text(0.5,0.98,figTitle, ha='center', va='top', fontsize='x-large')
for i in range(3) :
    ax =fig.add_subplot(131+i, projection='3d', aspect='equal')
    fig.text(ofst[i],0.02,title[i], ha='center', va='bottom', fontsize='large')
    ax.set_axis_off()
    if i==0 :
        ax.add_collection3d(edges.fade(.1))
        ax.scatter(*vertices, c=w, cmap=cmap, s=50,edgecolor='0.7')
    elif i==1 :
        ax.add_collection3d(surface.shade(flat=False))
    else :
        ax.add_collection3d(surfacev.shade(flat=False))
    usc = .72 if i<=1 else 0.6  # compensate for colorbar space.
    s3d.auto_scale(ax,surface,uscale=usc)

cbar = plt.colorbar(surfacev.cBar_ScalarMappable, ax=ax,  shrink=0.7 )
cbar.set_label('vertex values', rotation=270, labelpad=5)

fig.tight_layout()
plt.show()
