import numpy as np
import matplotlib.pyplot as plt
import s3dlib.surface as s3d
#.. Geometric and Color Datagrid Mapping
# 1. Define function to examine ....................................
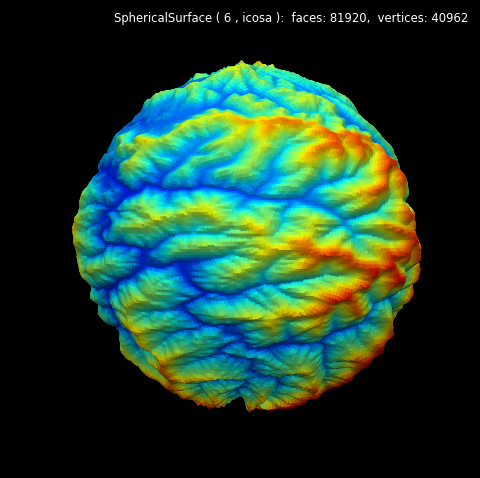
Z=np.load('data/jacksboro_fault_dem.npz')['elevation']
datagrid = np.flip(Z,0)
# 2. Setup and map surfaces .........................................
rez=6
fault = s3d.SphericalSurface(rez, cmap='jet')
fault.map_cmap_from_datagrid(datagrid)
fault.map_geom_from_datagrid(datagrid, scale=0.2)
fault.shade(direction=[0,1,1],contrast=0.8)
# 3. Construct figure, add surfaces, and plot ......................
fig = plt.figure(figsize=plt.figaspect(1), facecolor='black' )
fig.text(0.975,0.975,str(fault), ha='right', va='top',
fontsize='smaller', multialignment='right', color='white')
ax = plt.axes(projection='3d', aspect='equal')
minmax = (-0.8,0.8)
ax.set(xlim=minmax, ylim=minmax, zlim=minmax)
ax.set_facecolor('black')
ax.set_axis_off()
ax.view_init(0,90)
ax.add_collection3d(fault)
fig.tight_layout()
plt.show()