MRI 3D

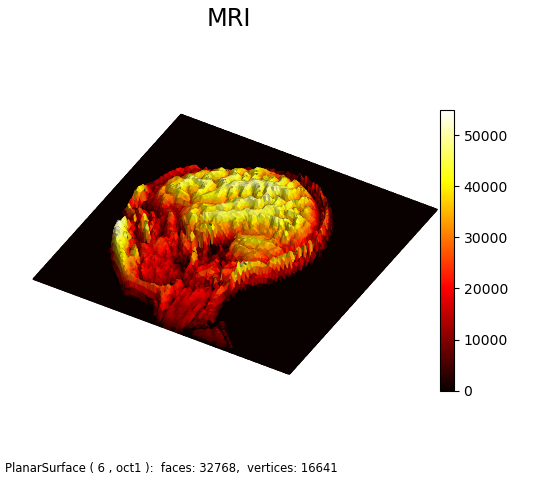
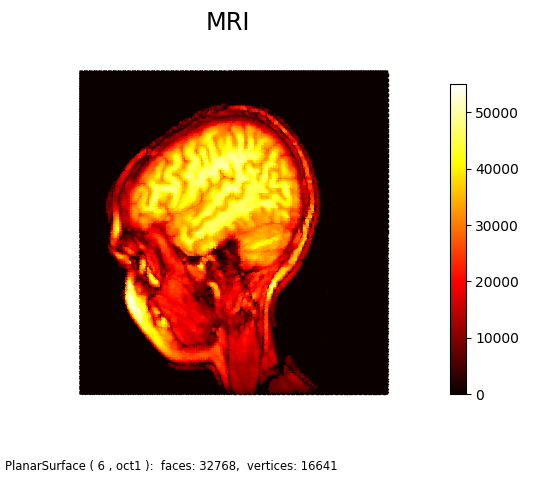
This figure is an alternative representation for MRI Image demo Matplotlib example. As seen below, when viewed normal to the x-y plane without shading, it is similar to the Matplotlib example.

The following script was used to generate both the above figures, only changing the Boolean value in the highlighted script.
import gzip
import numpy as np
from matplotlib import pyplot as plt
import s3dlib.surface as s3d

# 1. Define function to examine .....................................

with gzip.open('data/s1045.ima.gz') as datafile:
    s = datafile.read()
Z = np.frombuffer(s, np.uint16).astype(float).reshape((256, 256))
Z = np.flip(Z,0)

# 2. Setup and map surfaces .........................................
rez=6

surface = s3d.PlanarSurface(rez, basetype='oct1', name='MRI')
surface.map_cmap_from_datagrid( Z, 'hot' )

# 3. Construct figure, add surface, plot ............................
show3D = True

minmax = (-0.9,0.9)
fig = plt.figure(figsize=plt.figaspect(0.9))
fig.text(0.01,0.01,str(surface), ha='left', va='bottom', fontsize='smaller')
ax = plt.axes(projection='3d')
ax.set_proj_type('ortho')
ax.set(xlim=minmax, ylim=minmax, zlim=minmax )
ax.set_axis_off()
ax.set_title(surface.name, fontsize='xx-large')
cbar = plt.colorbar(surface.cBar_ScalarMappable, ax=ax,  shrink=0.65, pad=-.01 )
cbar.set_label(surface.cname, rotation=270, labelpad = 15)

if show3D :
    ax.view_init(40,-60)
    surface.map_geom_from_datagrid( Z, scale=.3 ).shade(.1,ax=ax)
else :
    ax.view_init(90,-90)

ax.add_collection3d( surface)

fig.tight_layout(pad=1)
plt.show()
