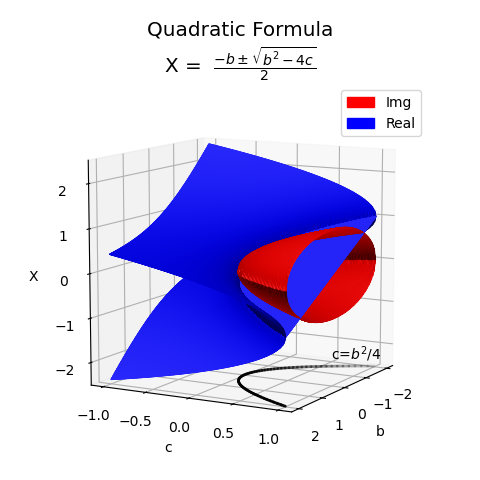
import numpy as np
from matplotlib import pyplot as plt
import matplotlib.patches as mpatches
import s3dlib.surface as s3d

#.. Quadratic Formula

# 1. Define function to examine .....................................

def b2_is_4c(t):  # line for the sqrt is zero, z-offset
    b = 4*t - 2
    c = b**2/4
    z = -2.5*np.ones(len(t))
    return b,c,z

def quadratic(xyz,isReal,isPos) :
    b,c,x = xyz
    plusMinus = 1.0 if isPos else -1.0
    zeros = np.zeros(len(x))
    sqrtval = plusMinus*np.sqrt(np.abs(b*b - 4*c))/2
    test = b*b > 4*c
    if isReal : x = -b/2.0 + np.where(test,sqrtval,zeros)
    else :      x = np.where(test,zeros,sqrtval)
    return b,c,x

# 2. Setup and map surfaces .........................................
rez = 6

surface1 = s3d.PlanarSurface(rez+1).domain(2)
surface2 = s3d.PlanarSurface(rez+1).domain(2)
surface1.map_geom_from_op( lambda c: quadratic(c,True,True) )
surface2.map_geom_from_op( lambda c: quadratic(c,True,False) )
rsurf = surface1 + surface2
rsurf.set_facecolor('b')

surface1 = s3d.PlanarSurface(rez).domain(2,[0,1])
surface2 = s3d.PlanarSurface(rez).domain(2,[0,1])
surface1.map_geom_from_op( lambda c: quadratic(c,False,True) )
surface2.map_geom_from_op( lambda c: quadratic(c,False,False) )
isurf = surface1 + surface2
zeroClip = lambda c : np.abs(c[2]) > 0.01
isurf.clip(zeroClip)
isurf.set_facecolor('r')
surface = rsurf+isurf

line = s3d.ParametricLine(5,b2_is_4c,color='k',lw=2)

# 3. Construct figure, add surface, plot ............................
formula = r"X =  $\frac{-b \pm \sqrt{b^{2}-4c}}{2}$"
fig = plt.figure(figsize=plt.figaspect(1.0))
fig.text(.69,.25,r'c=$b^2$/4')
ax = plt.axes(projection='3d', aspect='equal')
ax.view_init(10,29)

ax.set(xticks=(-2,-1,0,1,2), yticks=( -1,-.5,0,.5,1 ), zticks=(-2,-1,0,1,2),
       xlabel='b',ylabel='c',zlabel='X')
s3d.auto_scale(ax,surface)
ax.set_title('Quadratic Formula\n'+formula, fontsize='x-large')

ax.add_collection3d(surface.shade().hilite(.2))
ax.add_collection3d(line.fade(.2))

i_patch = mpatches.Patch(color='r', label='Img')
r_patch = mpatches.Patch(color='b', label='Real')
ax.legend(handles=[i_patch,r_patch])

fig.tight_layout(pad=1.5)
plt.show()