
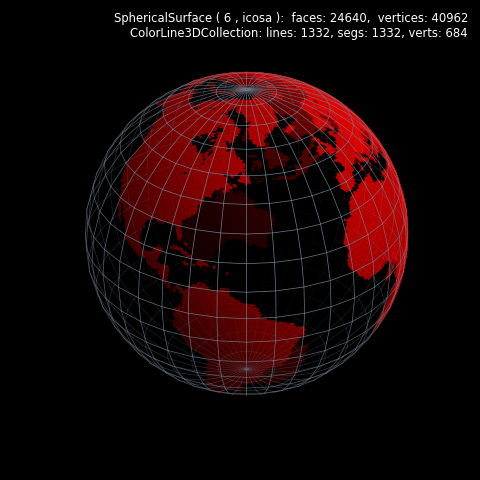
Image Value Clipping
import numpy as np
from matplotlib import pyplot as plt
import s3dlib.surface as s3d

#.. Image HSV Value Clipping

# 2. Setup and map surfaces .........................................
rez, nlng = 6,18

earth = s3d.SphericalSurface(rez)
earth.map_color_from_image('data/elevation.png')
earth.clip_alpha(.1,useval=True)
earth.set_color('red')
earth.transform(rotate=s3d.eulerRot(175,0) )
earth.shade( direction=[1,0.8,1] ).fade(.3)

grid = s3d.SphericalSurface.grid(nlng,2*nlng,'r').edges
grid.set_color('slategrey')
grid.set_linewidth(0.5)
grid.fade()

# 3. Construct figure, add surfaces, and plot ......................

minmax = (-0.85,0.85)
text = str(earth) + '\n' + str(grid)
fig = plt.figure(figsize=plt.figaspect(1), facecolor='black' )
fig.text(0.975,0.975,text, ha='right', va='top',
        fontsize='smaller', multialignment='right', color='white')
ax = plt.axes(projection='3d', aspect='equal' ,facecolor='k')
ax.set(xlim=minmax, ylim=minmax, zlim=minmax)
ax.set_axis_off()

ax.add_collection3d(earth)
ax.add_collection3d(grid)

fig.tight_layout(pad=0)
plt.show()
To use the earth image instead of coloring the surface red, replace the highlighted line by:
earth.map_color_from_image('data/earth.png')
which results in:
