
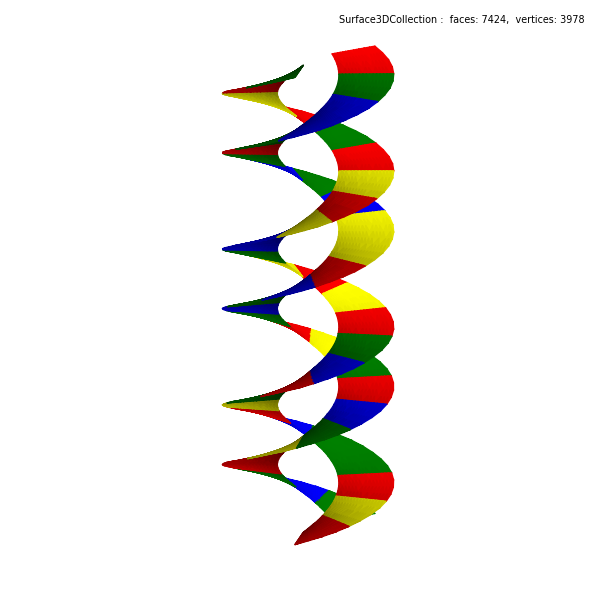
Helix Line Filled Surfaces
The ParametricLine constructor argument rez, when set negative, specifies the number of line segments. For this case, lines have exactly the number of segments as the number of code elements.
import numpy as np
import matplotlib.pyplot as plt
import s3dlib.surface as s3d

#.. Double Helix Surface from projected helix lines.

# 1. Define functions to examine ....................................
code = "AGATTCAGTACTAGAGTCCGAGATAGGAT"
k = 3                 # number of twists
p1, p2 = 13.0, 21.0   # double helix spacing
#hw, hl = 20.0        # helix width
#bppt = 10.5          # base pairs per twist
delta = np.pi*p1/(p1+p2)

def baseColor(codeString, isIn=False) :
    colors =  ['red','yellow','green','blue']
    codeInx = { 'A':0, 'G':1, 'T':2, 'C':3 }
    posMap = []
    for code in codeString :
        indx = codeInx[code] if isIn else (codeInx[code]+2)%4
        posMap.append( colors[indx] )
    return np.array(posMap)

def helix(t,isPos) :
    ofset = delta if isPos else -delta
    r = np.ones(len(t))
    T = 2*k*t*np.pi + ofset
    z = 2*t - 1
    return s3d.CylindricalSurface.coor_convert([r,T,7*z],True)

top_helix = lambda t: helix(t,True)
btm_helix = lambda t: helix(t,False)
mid_helix = lambda t: ( np.array(top_helix(t)) + np.array(btm_helix(t)) )/2.0

def unitRadius(xyz) :
    r,t,z = s3d.CylindricalSurface.coor_convert(xyz,False)
    return s3d.CylindricalSurface.coor_convert([np.ones(len(r)),t,z],True)

# 2. Setup and map surfaces .........................................
rez, lrez, shrez = -len(code), 4, 2

line_1 = s3d.ParametricLine(rez,top_helix,lw=4)
line_2 = s3d.ParametricLine(rez,btm_helix,lw=4)

line_1.shred(0).set_color( baseColor(code,False) )
line_2.shred(0).set_color( baseColor(code,True) )

line = line_1 + line_2
line.shred(shrez).map_geom_from_op(unitRadius)

surface = line.get_filled_surface(coor='c',dist=0.36, lrez=lrez )
surface.evert().triangulate()

# 3. Construct figure, add surfaces, and plot ......................

minmaxZ, minmax = (-5,5), (-2.0,2.0)

fig = plt.figure(figsize=(6,6))
fig.text(0.975,0.975,str(surface), ha='right', va='top', fontsize='x-small')
ax = plt.axes(projection='3d', aspect='equal')
ax.set(xlim=minmax, ylim=minmax, zlim=minmaxZ)
ax.set_axis_off()
ax.set_proj_type('ortho')
ax.view_init(13)

ax.add_collection3d(surface.shade())

fig.tight_layout(pad=0)

plt.show()