Cylindrical Surface Contours
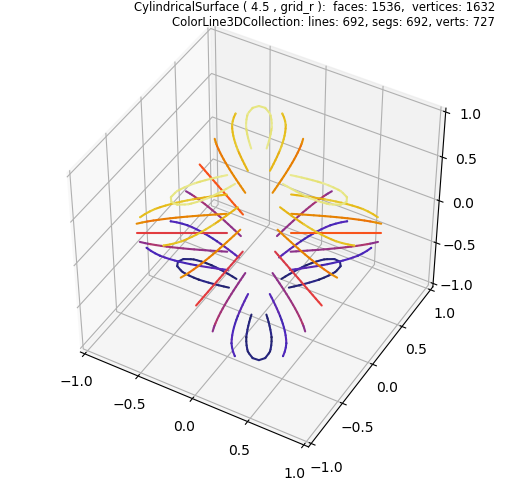
This is a comparison to the Triangular 3D contour plot Matplotlib example.

Contours are created from a surface, as shown on the highlighted line below. Contour color is taken from the surface, which is not shown.
import copy
import numpy as np
from matplotlib import pyplot as plt
import s3dlib.surface as s3d
import s3dlib.cmap_utilities as cmu

#.. Matplotlib Examples: Cylindrical Surface Contours

# 1. Define functions to examine ....................................

def ribbonFunc(rtz) :
    r,t,z = rtz
    min_radius, max_radius = 0.25, 0.95
    d = (max_radius-min_radius)/2
    # convert cylinder to flat ring, R = f(z)
    R = d + min_radius + d*z
    Z = np.cos(R)*np.sin(3*t)
    T = t + np.pi/2  # rotate...
    return R,T,Z

# 2. Setup and map surfaces .........................................

ribbon = s3d.CylindricalSurface.grid(8*2,48*2,'r')
ribbon.map_geom_from_op( ribbonFunc )
ribbon.map_cmap_from_op(lambda c: c[2], 'CMRmap' )
contours = ribbon.contourLineSet(7, coor='p')

# 3. Construct figure, add surfaces, and plot ......................
minmax, ticks = (-1,1), [-1,-.5,0,.5,1]
fig = plt.figure(figsize=plt.figaspect(1.1))
fig.text(0.98,0.945,str(ribbon)+'\n'+str(contours), ha='right',fontsize='small')
ax = plt.axes(projection='3d', aspect='equal')
ax.set(xlim=minmax, ylim=minmax, zlim=minmax,
        xticks=ticks, yticks=ticks, zticks=ticks )
ax.view_init(elev=45.)

ax.add_collection3d(contours)

fig.tight_layout()
plt.show()
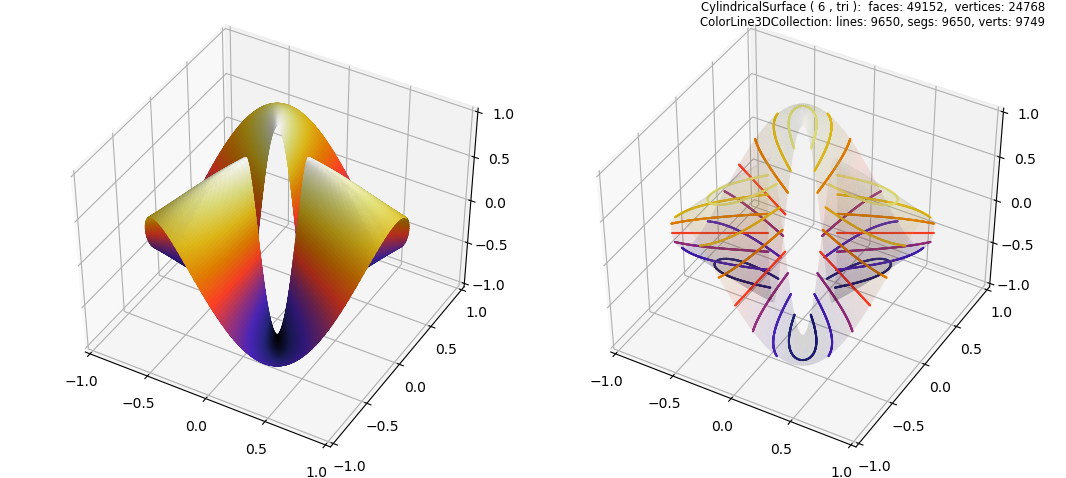
The 3D interpretation of the contours is more apparent when shown in comparison to the surface, as seen below.

The Matplotlib annotation for the above plot follows. For clarity, the higher resolution surface is shown (the line commented-out in the above script).
ribbon2 = copy.copy(ribbon)  # needed for use on two Matplotlib axes

minmax, ticks = (-1,1), [-1,-.5,0,.5,1]
fig = plt.figure(figsize=plt.figaspect(.6))
fig.text(0.98,0.945,str(ribbon)+'\n'+str(contours), ha='right',fontsize='small')
for i in range(2) :
    ax = fig.add_subplot(121+i, projection='3d')
    ax.set_aspect('equal')
    ax.set(xlim=minmax, ylim=minmax, zlim=minmax,
            xticks=ticks, yticks=ticks, zticks=ticks )
    ax.view_init(elev=45.)

    if i==1 :
        ax.add_collection3d(contours)
        ribbon = ribbon2.set_surface_alpha(.1)
    ax.add_collection3d(ribbon.shade(.4,ax=ax))

fig.tight_layout()
plt.show()
