
Matplotlib Examples
The following examples are based on examples in the 3D plotting Gallery of Matplotlib. This set of examples compare the methodology of forming 3D visulizations between Matplotlib and S3Dlib.
Matplotlib. Initially, x,y,z coordinates are constructed. The coordinates are then passed to specific Axes3D methods, eg. plot, plot_wireframe, plot_surface, plot_trisurf, contour, etc.
S3Dlib. First, base 3D objects are instantiated ( surface, line, or vectors ) to established the network relationship among the vertex coordinates. Functions are then used to map coordinates and colors to produce the final object. Mutliple mapping operations may be performed on the same object and objects. Additionally, objects of the same class may be added together to form one object. Finally, objects are added to the Axes3D.
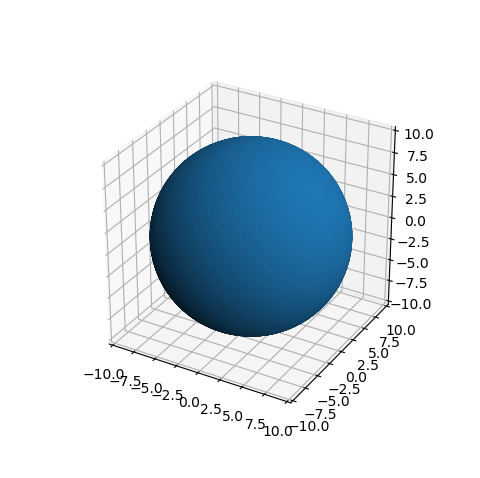
3D Surface
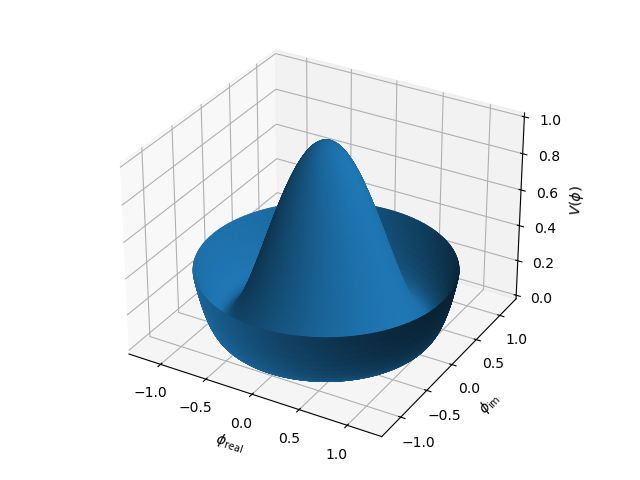
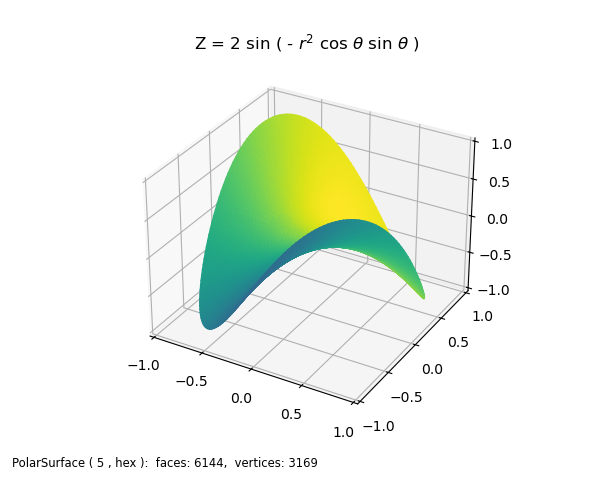
3D Surface in Polar Coordinates
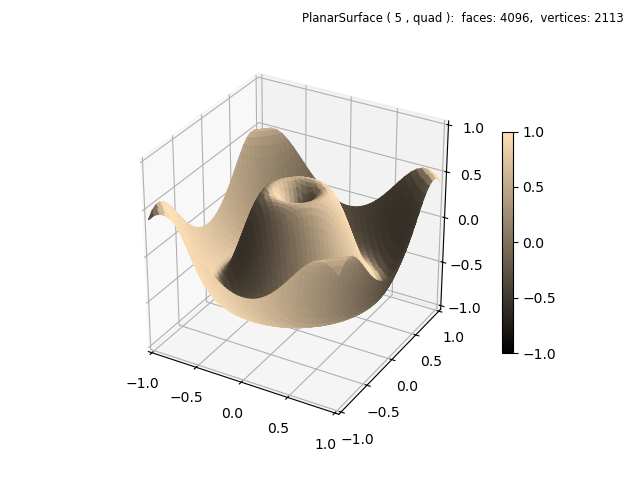
Shading
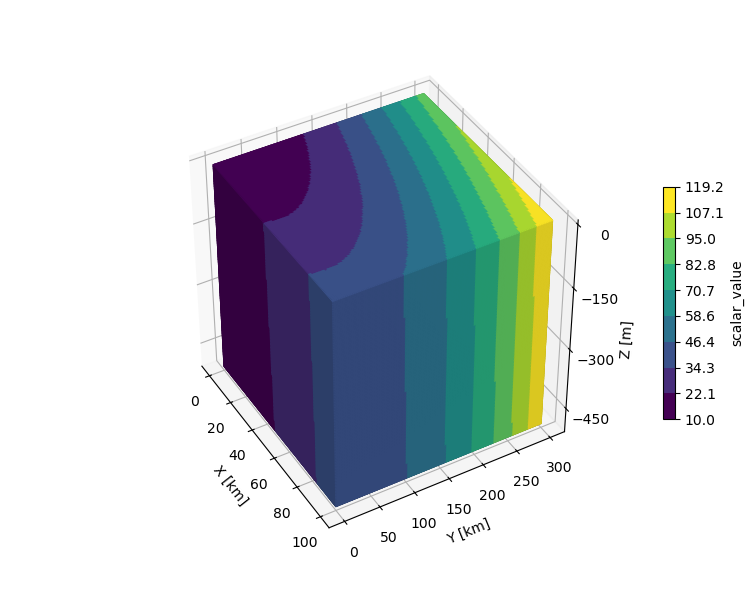
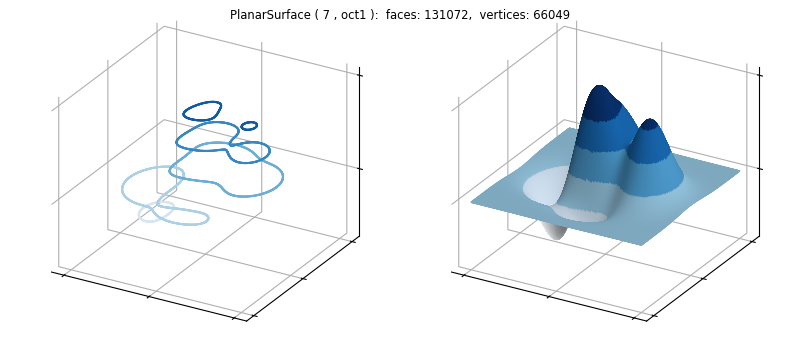
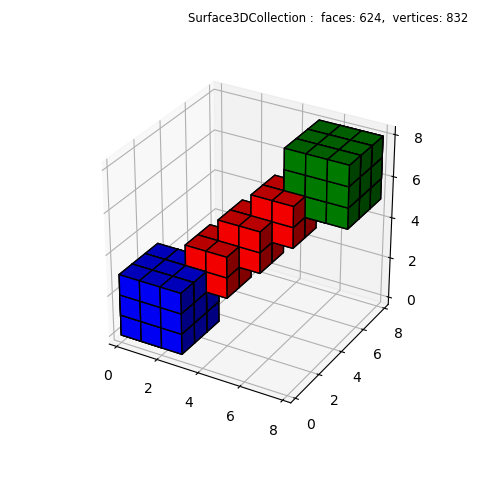
3D Box Surface Plot
Color Mapping Normals
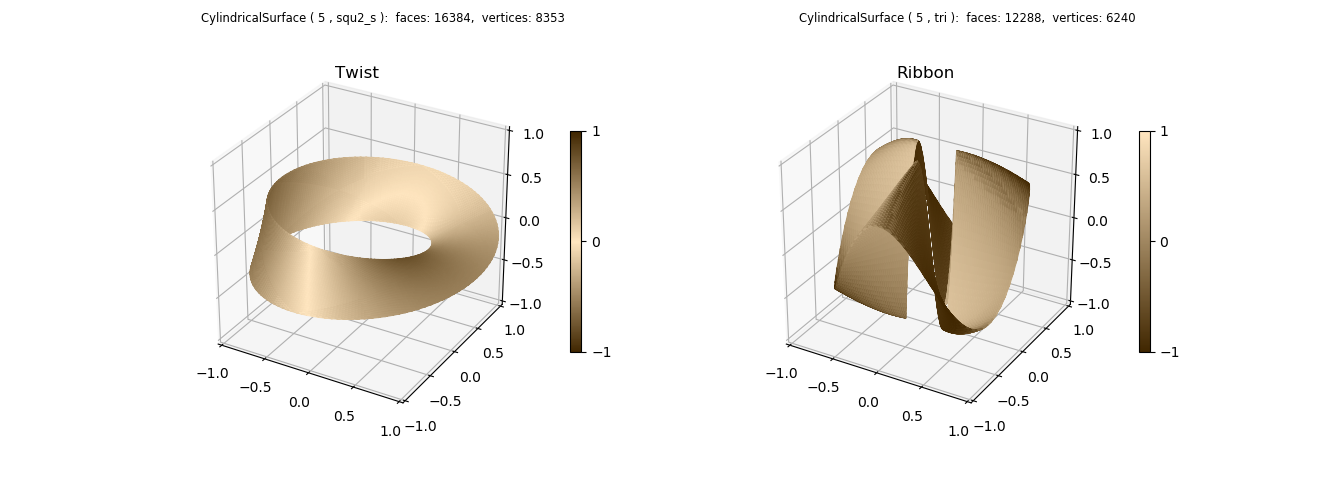
Cylindrical Coordinates
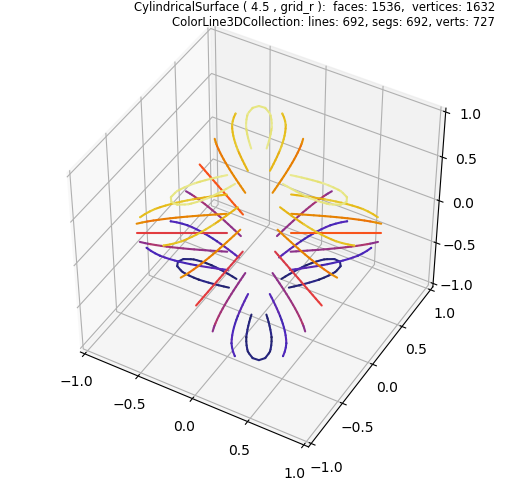
Cylindrical Surface Contours

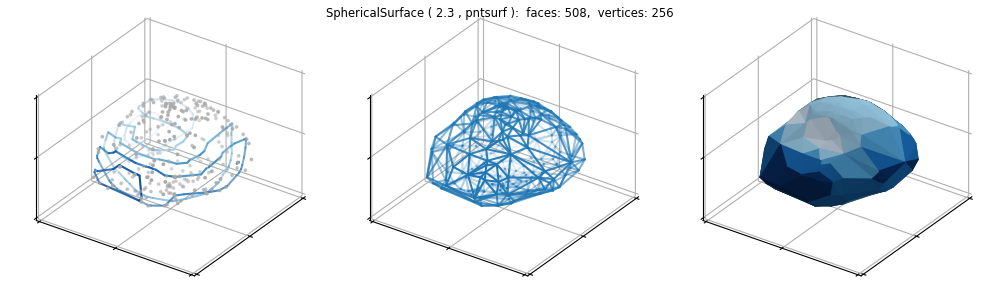
Unstructured coordinates
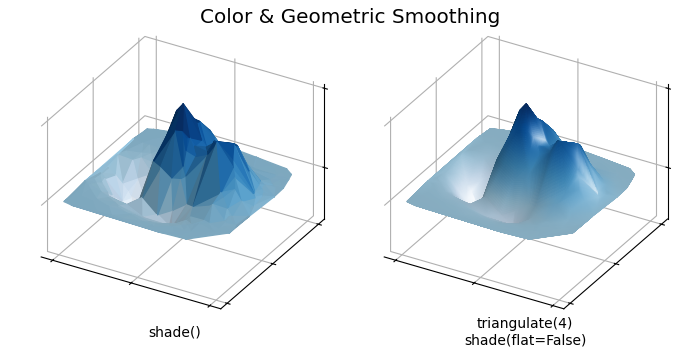
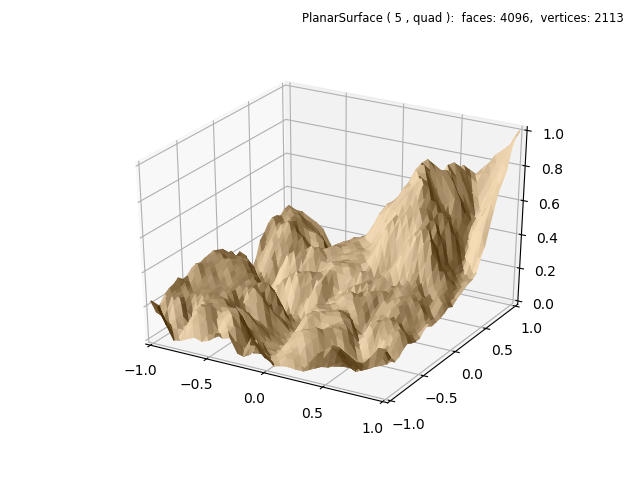
Unstructured coordinates, Smoothed Surface
Unstructured Spherical and Cylindrical Coordinates
Contours
Spherical and Cylindrical Contours

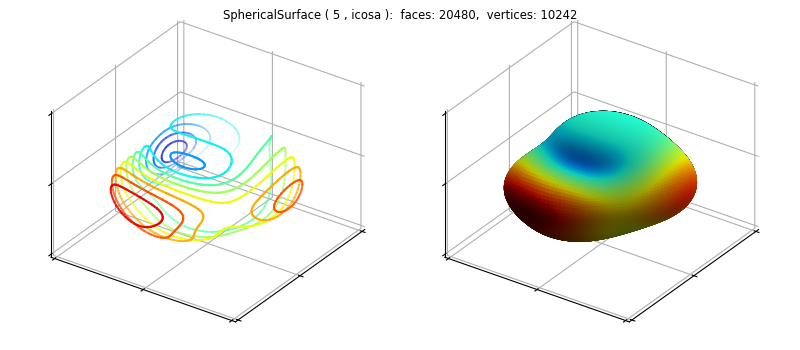
Scalar Function Colormapping on a 3D Surface

Data Density Plots
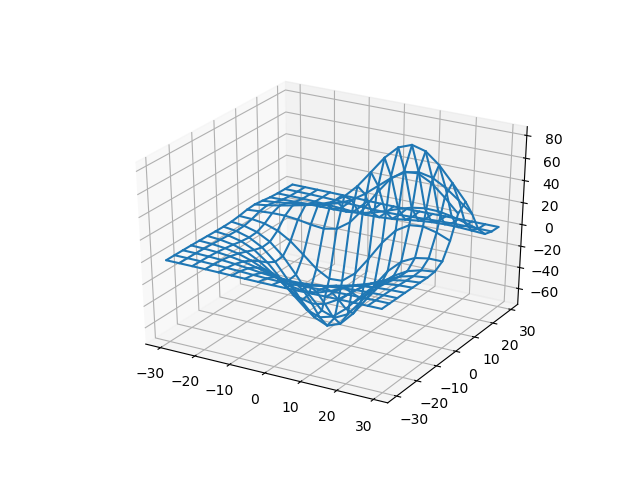
Datagrid Surface Wireframe Plot
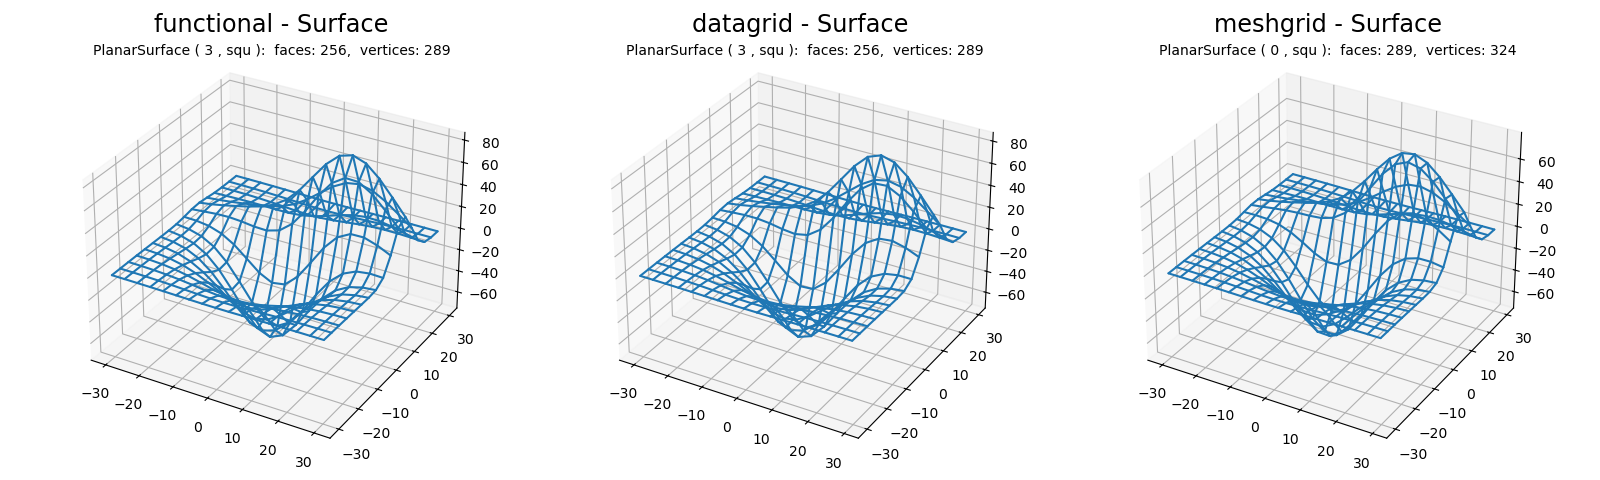
Functional, Datagrid and Meshgrid Surface wireframe plots
Datagrid Geometry
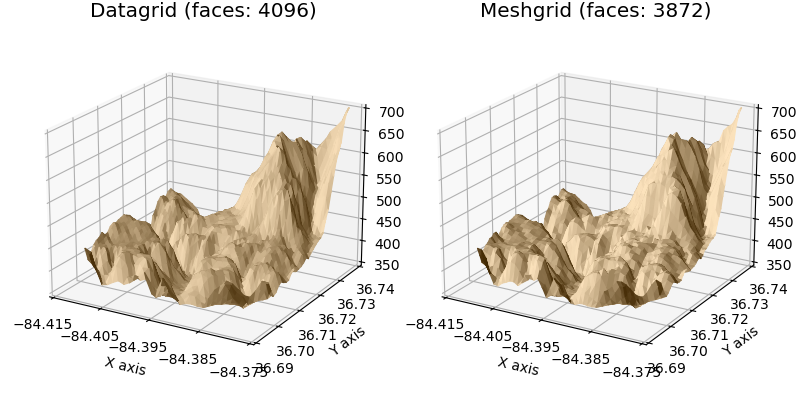
Datagrid and Meshgrid surfaces
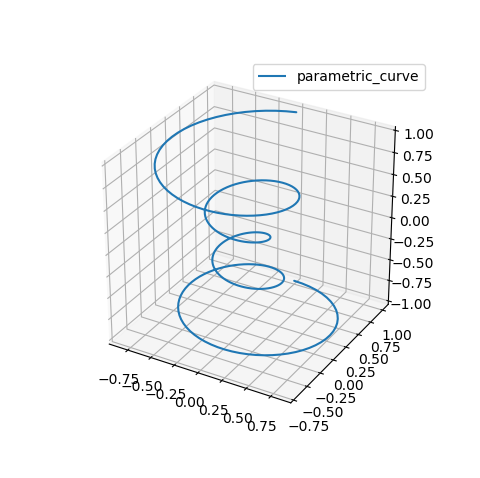
Parametric Curve
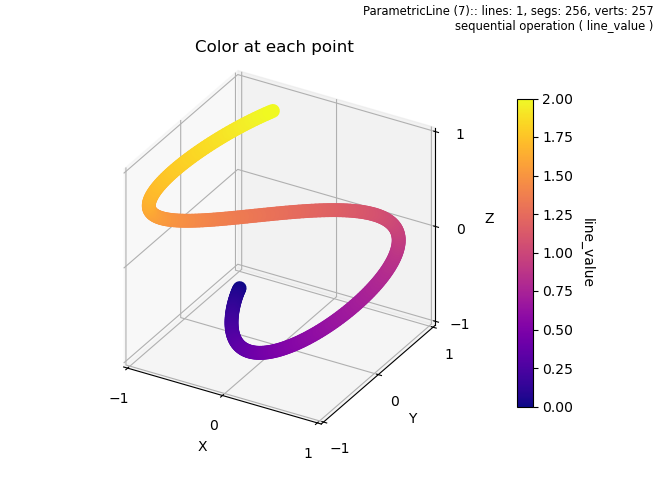
Multicolored line
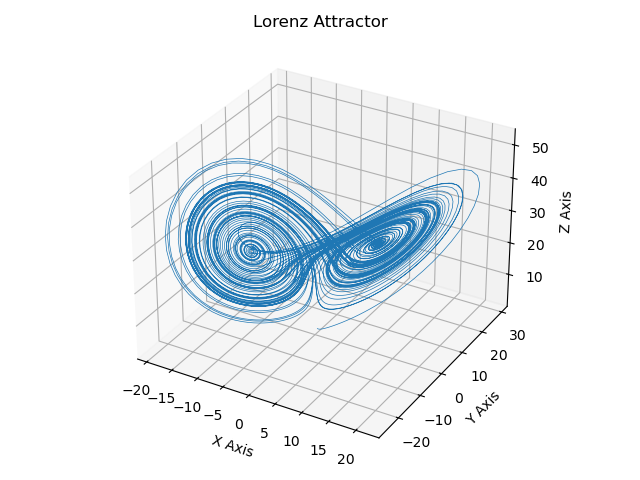
Lorenz Attractor
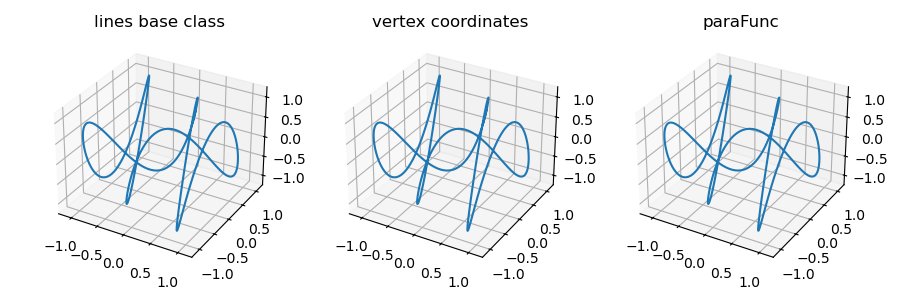
Line Class Comparison
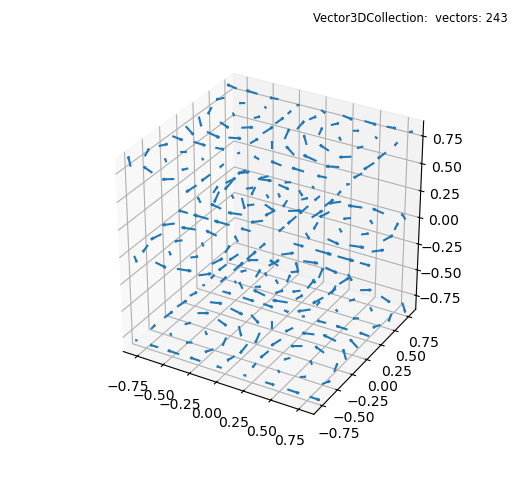
3D quiver plot
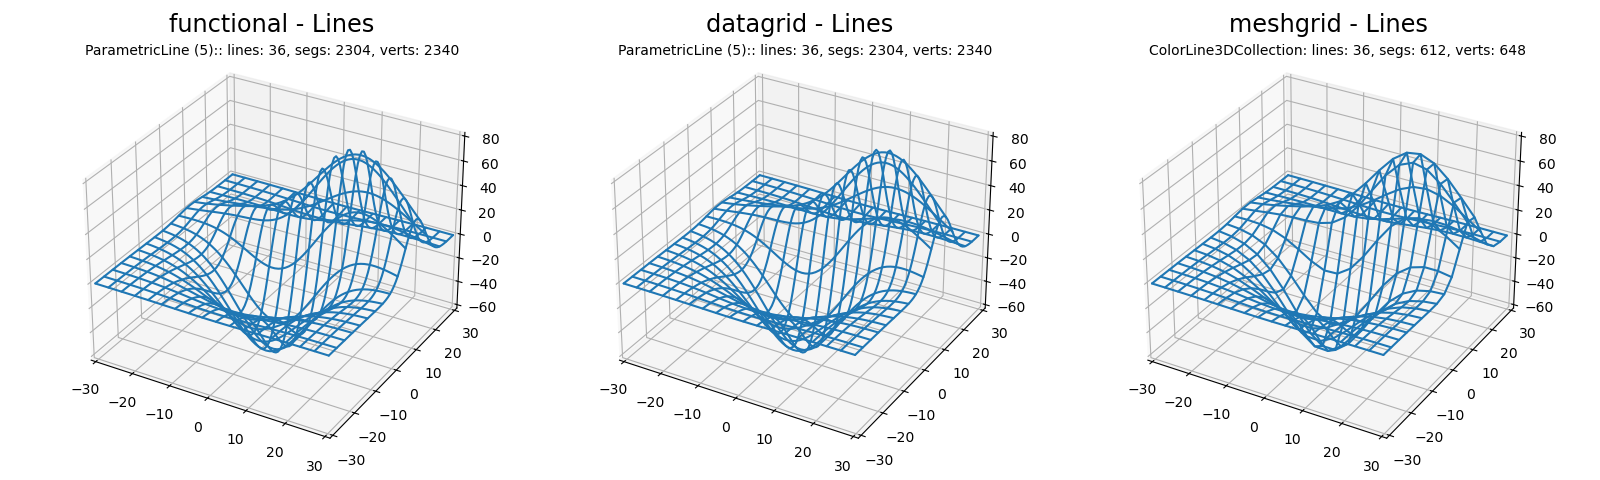
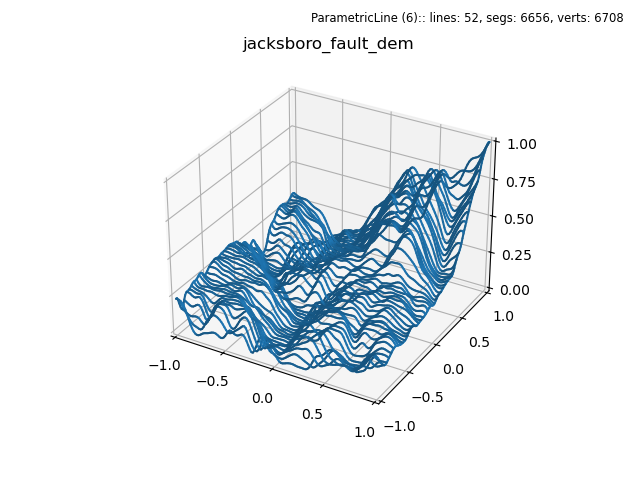
Functional, Datagrid and Meshgrid Line wireframe plots
Datagrid Slices

Contour Levels in 3D
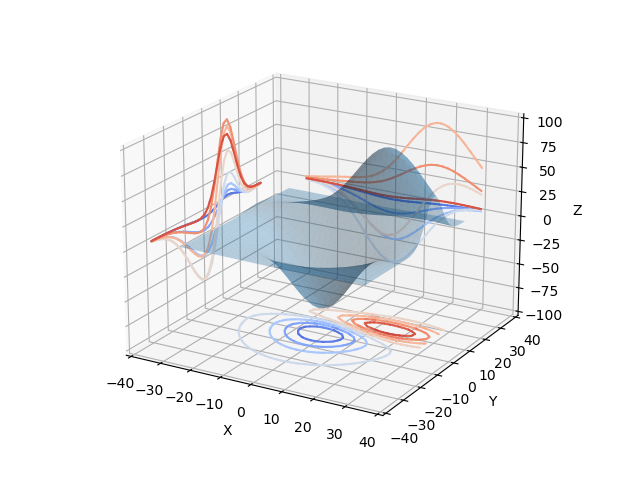
Projecting contour profiles

Filled 3D Line Graph
Volumetric Plot

Volumetric Plot with RGB