
Contour Levels in 3D
This is a comparison to the Demonstrates plotting contour (level) curves in 3D Matplotlib example.

In the above plot, contours are explicitly set at 8 locations of -60,-40,… etc. using the contourLines surface method (default z-direction). To set 8 evenly spaced contours from the minimum to maximum z-range of the surface, use the method:
z_contours = surface.contourLineSet(8)
which will result in the plot shown below:
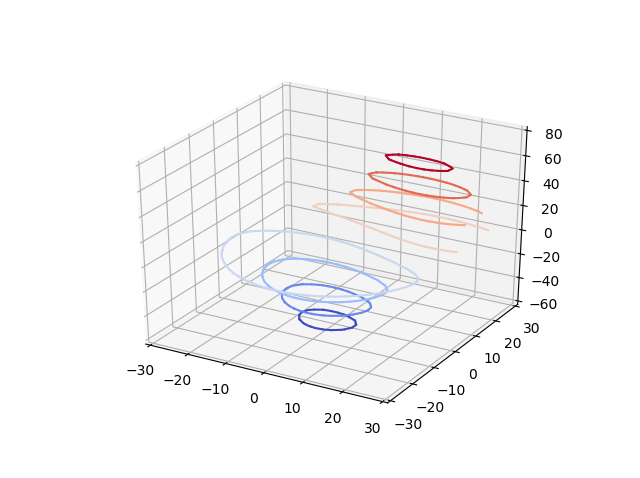
This minor change would occur at highlighted line in the following script.
import numpy as np
import matplotlib.pyplot as plt
from matplotlib.ticker import LinearLocator
from mpl_toolkits.mplot3d import axes3d
import s3dlib.surface as s3d

#.. Matplotlib Examples: Demonstrates plotting contour (level) curves in 3D

# 1. Define function to examine .....................................

X, Y, Z = axes3d.get_test_data(0.05)

# 2. Setup and map surfaces .........................................
rez=5

surface = s3d.PlanarSurface(rez, basetype='oct1')
surface.map_geom_from_datagrid( Z ).scale_dataframe(X,Y,Z)

z_contours = surface.contourLines( *np.linspace(-60,80,8) )
#z_contours = surface.contourLineSet(8)
z_contours.map_cmap_from_op( lambda xyz : xyz[2],'coolwarm')

# 3. Construct figure, add surface, plot ............................

fig = plt.figure()
ax = plt.axes(projection='3d')
ax.set(xlim=(-30,30), ylim=(-30,30), zlim=(-60,80) )
ax.xaxis.set_major_locator(LinearLocator(7))
ax.yaxis.set_major_locator(LinearLocator(7))
ax.zaxis.set_major_locator(LinearLocator(8))

ax.add_collection3d(z_contours)

plt.show()