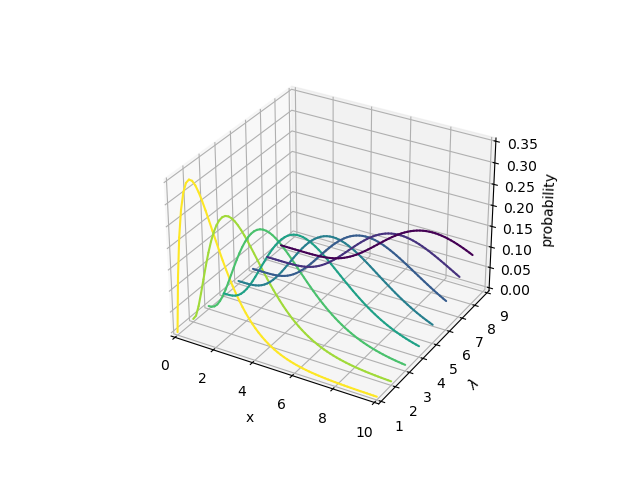
Filled 3D Line Graph
This is a comparison to the Generate polygons to fill under 3D line graph Matplotlib example. Alternative coloring of the filled line is shown in the Comparison of Filled Slice Coloring example.

import numpy as np
from matplotlib import pyplot as plt
import s3dlib.surface as s3d
from scipy.stats import poisson

# 1. Define function to examine .....................................

# Fixing random state for reproducibility
np.random.seed(19680801)

def poisson_function(xyz) :
    x,y,z = xyz
    Z = poisson.pmf(y, x)
    return x,y,Z

# 2. Setup and map surfaces .........................................
rez=5

line = s3d.ParametricLine(rez)
line.map_xySlice_from_op( poisson_function, yset=8, xlim=(0,10), ylim=(1,8) )
line.map_cmap_from_op( lambda xyz: xyz[1],'viridis_r')
surface = line.get_filled_surface()
surface.set_surface_alpha(.7)

# 3. Construct figures, add surface, plot ...........................

fig = plt.figure()
ax = plt.axes(projection='3d')
ax.set(xlim=(0, 10), ylim=(1, 9), zlim=(0, 0.35),
       xlabel='x', ylabel=r'$\lambda$', zlabel='probability')

ax.add_collection3d(surface)
#ax.add_collection3d(line)   # <-- use this to show line instead of surfaces.

plt.show()
The surfaces are colored using the line colors. As an alternative, the surfaces may be colored directly without coloring the lines using:
surface.map_cmap_from_op( lambda xyz: xyz[1],'viridis_r')
The lines can be shown by adding the lines to the axes instead of the surface which produces: