
Spherical and Cylindrical Contours
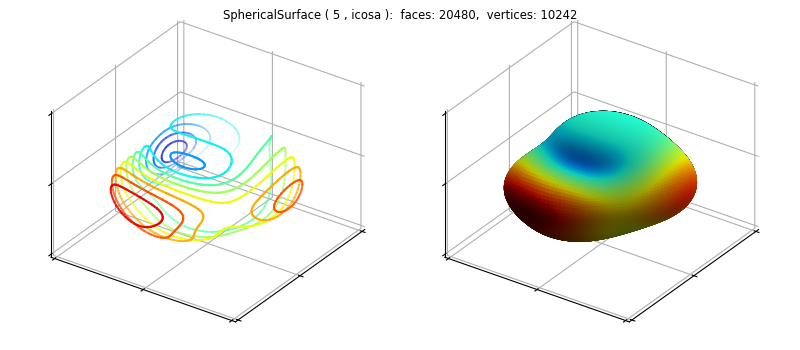
Creating contours in spherical coordinates is similar to using a planar coordinated system shown in the Contours example. For this case, a ‘jet’ colormamp was used to enhance the visualizations for these surfaces.
import numpy as np
import matplotlib.pyplot as plt
import s3dlib.surface as s3d

#.. Contours in spherical coordinates

#.. Matplotllib Examples: contour(x, y, z) and contourf(x, y)
def z_func(xyz) :
    x,y,z = xyz
    Z =  (1 - x/2 + x**5 + y**3) * np.exp(-x**2 - y**2)
    return x,y,Z

pi = np.pi

def rpt_func(rtp) :
    r,t,p = rtp
    # map to flat xyz plane [-3,3]
    x = 3*(t/pi - 1)
    y = 3*(2*p/pi -1)
    z = np.zeros(len(x))
    x,y,z = z_func([x,y,z])  # <-- use Matplotlib functional form
    r = z + 2   # <-- shift the radius
    return r,t,p

# 2. Setup and map surface .........................................
rez = 5
surface = s3d.SphericalSurface(rez,cmap='jet').domain(3)
surface.map_geom_from_op(rpt_func)
surface.map_cmap_from_op()  # default: radial direction operation

contours = surface.contourLineSet(10) # default: spherical contours

# 3. Construct figure, add surface, and plot ......................

fig = plt.figure(figsize=(8,3.5))
fig.text(0.5,0.975,str(surface), ha='center', va='top', fontsize='smaller')
minmax,ticks = (-3,3),[-3,0,3]
for i in range(2) :
    ax = fig.add_subplot(121+i, projection='3d')
    ax.set(xticks=ticks,yticks=ticks,zticks=ticks,
           xlim=minmax, ylim=minmax, zlim=minmax )
    ax.tick_params(labelcolor='w')
    ax.set_proj_type('ortho')
    ax.view_init(azim=-145)
    ax.xaxis.set_pane_color([1,1,1])
    ax.yaxis.set_pane_color([1,1,1])
    ax.zaxis.set_pane_color([1,1,1])

    ax.add_collection3d(contours.fade(ax=ax) if i==0 else surface.shade(.2,ax=ax))

fig.tight_layout(pad=0)

plt.show()
Using a cylindrical dataset results in the following.
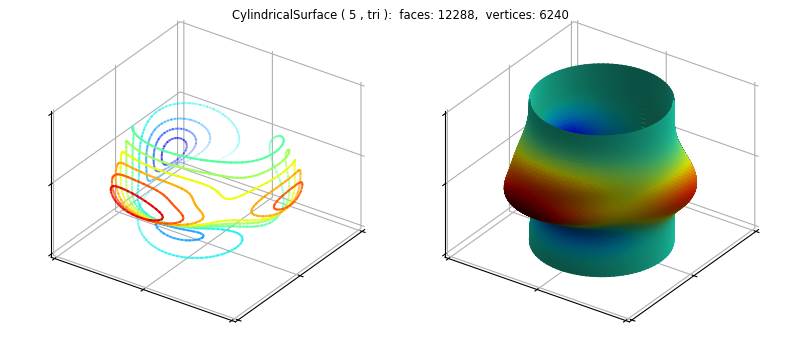
The only change to the script to produce the 3D figure in cylindrical coordinates is the following:
def rpz_func(rtz) :
    r,t,z = rtz
    # map to flat xyz plane [-3,3]
    x = 3*(t/pi - 1)
    y = 3*z
    z = np.zeros(len(x))
    x,y,z = z_func([x,y,z])  # <-- use Matplotlib functional form
    r = z + 2   # <-- shift the radius
    Z = y
    return r,t,Z

# 2. Setup and map surface .........................................
rez = 5
surface = s3d.CylindricalSurface(rez,cmap='jet').domain(3)
surface.map_geom_from_op(rpz_func)
surface.map_cmap_from_op()  # default: radial operation, along z

contours = surface.contourLineSet(10) # default: cylincrical contours