import numpy as np
from matplotlib import pyplot as plt
import s3dlib.surface as s3d
#.. Three classes for a line object
# 1. Define function to examine .....................................
t = np.arange(0, 2*np.pi+.1, 0.01)
x, y, z = np.sin(t), np.cos(3*t), np.sin(5*t)
vertexCoor = np.array( [x,y,z] ).T
segmIndices = [range( len(vertexCoor) )]
def paraFunc(t) :
t = 2*np.pi*t
x, y, z = np.sin(t), np.cos(3*t), np.sin(5*t)
return x,y,z
# 2. Setup and map line .............................................
rez = 7
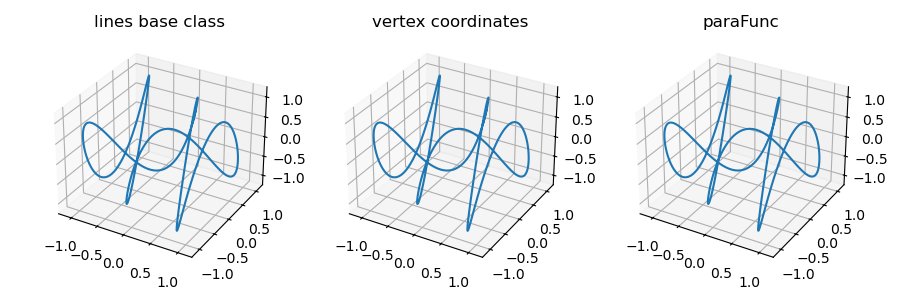
line0 = s3d.ColorLine3DCollection(vertexCoor,segmIndices,'lines base class')
line1 = s3d.SegmentLine(vertexCoor,'vertex coordinates')
line2 = s3d.ParametricLine(rez,paraFunc)
# 3. Construct figure, add line and plot ............................
minmax = (-1.2,1.2)
lines = [ line0,line1,line2]
fig1 = plt.figure(figsize=[9,3])
for i,line in enumerate(lines) :
ax = fig1.add_subplot(131+i, projection='3d')
ax.set(xlim=minmax, ylim=minmax, zlim=minmax )
ax.set_title(line.name)
ax.add_collection3d(line)
fig1.tight_layout(pad=2)
plt.show()