Datagrid Surface Wireframe Plot
Surface geometry is that taken from the matplotlib 3D wireframe plot example.
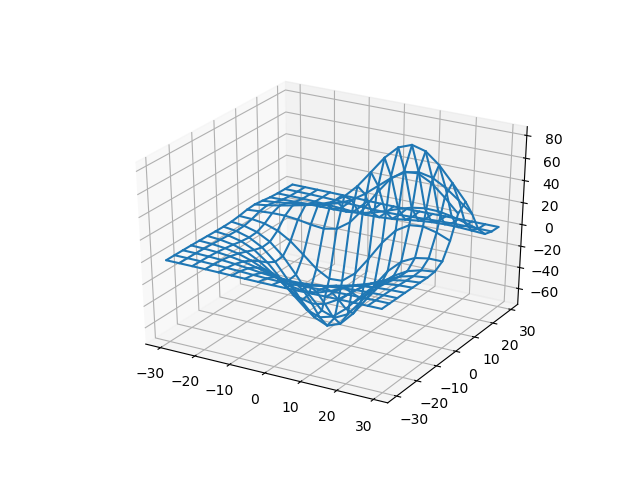
When using a datagrid directly with a PlanarSurface object, the data is scaled along the z-axis range [0,1]. Additional scaling is indicated in the highligted line.
import numpy as np
import matplotlib.pyplot as plt
from mpl_toolkits.mplot3d import axes3d
import s3dlib.surface as s3d

#.. Matplotlib Examples: Datagrid Wireframe plot

# 1. Define data to examine .........................................

X, Y, Z = axes3d.get_test_data()

# 2. Setup and map surfaces .........................................
rez=3

surface = s3d.PlanarSurface(rez, basetype='squ')
surface.map_geom_from_datagrid( Z )
surface.scale_dataframe(X,Y,Z)

# 3. Construct figure, add surface, plot ............................

fig = plt.figure()
ax = plt.axes(projection='3d')
s3d.auto_scale(ax,surface)
ax.view_init(20)
ax.add_collection3d(surface.edges)

fig.tight_layout()
plt.show()
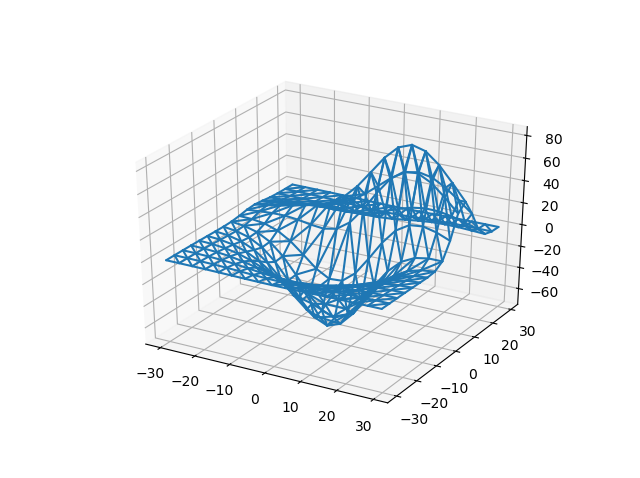
Use the alternative basetype:
surface = s3d.PlanarSurface(rez, basetype='oct1')
to visualize the triangulated surface edges, producing the following figure. Triangular surfaces objects are generally appropriate when the surface faces are shown.