Data Density Plots
This is a comparison to the Exploring normalizations Matplotlib example.

This example demonstrates the use of the S3Dlib functions:
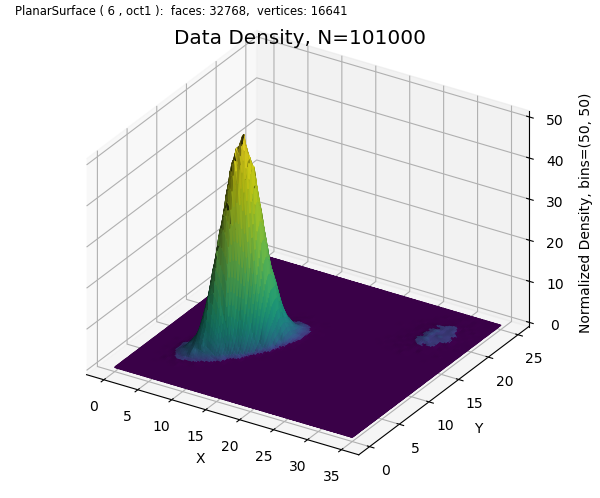
density_function returns a function, f(x,y), which is created from a set of x,y coordinates argument and a bins argument analogous to 2D histogram creation methods. The returned function,f, computes the data density at x,y coordinates passed to the function. The volume of density surface is normalized to 1 but may be scaled using the scale argument.
op_cmap is a S3Dlib colormap utility function which generates a colormap from a function which is passed as an argument. In this example, the function passed, power, provided a colormap equivalent to the Matplotlib colors.PowerNorm
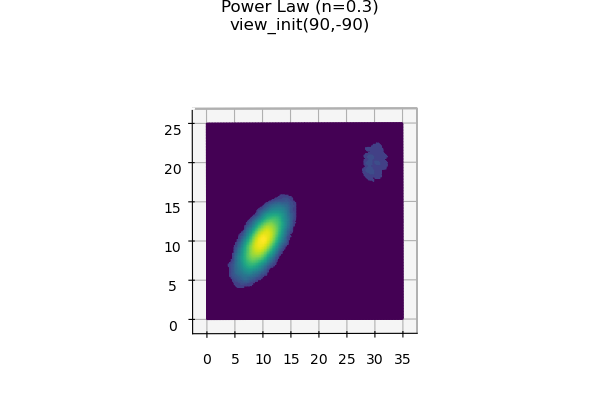
The 2D plot can be visualized by rotating the surface using ax.view_init(90,-90). The angles used for view_init were offset from 90 to force axis label positions in the 3D rendering. The result is a figure similar to a 2D histogram as shown below.

import numpy as np
from numpy.random import multivariate_normal
import matplotlib.pyplot as plt
from matplotlib import cm,colormaps
import s3dlib.surface as s3d
import s3dlib.cmap_utilities as cmu

#.. Matplotlib Examples: 3D surface histogram with normalization distribution

# 1. Define function to examine .....................................
rez, bns, N = 6, (50,50), 150

np.random.seed(19680801)
data = np.vstack([
    multivariate_normal([10, 10], [[3, 2], [2, 3]], size=100000),
    multivariate_normal([30, 20], [[3, 1], [1, 3]], size=1000)
])

data = data.T

f = s3d.density_function(data,bins=bns,scale=True)

def surfDist(xyz):
    x,y,z=xyz
    return x,y,f(x,y)    # use density function for Z

def power(t,n) :
    return colormaps['viridis'](np.power(t,n)).T

cmap= cmu.op_cmap(lambda t: power(t,0.3), name='Power Law (n=0.3)')

# FIGURE 1 : Density Surface ====================================================
# ===============================================================================

# 2. Setup and map surfaces .........................................

surface = s3d.PlanarSurface(rez,'oct1').domain([0,35],[0,25])
surface.map_geom_from_op(surfDist)
surface.map_cmap_from_op(cmap=cmap)

# 3. Construct figure, add surface, plot ............................
fig = plt.figure(figsize=(6,5))
fig.text(0.025,0.99,str(surface), ha='left', va='top', fontsize='smaller')
ax = plt.axes(projection='3d')
s3d.auto_scale(ax,surface)
ax.add_collection3d(surface.shade())
zlabel = 'Normalized Density, bins='+str(bns)
ax.set(xlabel='X',ylabel='Y',zlabel=zlabel)
ax.set_proj_type('ortho')
ax.view_init(35,-58)
title = "Data Density, N="+ str(len(data[0]))
ax.set_title(title , fontsize='x-large' )
fig.tight_layout()

# FIGURE 2 : Top View of Density Surface ========================================
# ===============================================================================

surface2 = s3d.PlanarSurface(rez,'oct1').domain([0,35],[0,25])
surface2.map_geom_from_op(surfDist)
surface2.map_cmap_from_op(cmap=cmap)

# 3. Construct figure, add surface, plot ............................
fig = plt.figure(figsize=(6,4))
ax2 = plt.axes(projection='3d')
s3d.auto_scale(ax2,surface2)
ax2.add_collection3d(surface2)
ax2.set(xlabel='',ylabel='')
ax2.tick_params("z",  colors='w')
ax2.set_proj_type('ortho')
ax2.view_init(89.7,-90.1)
ax2.set_title( cmap.name+'\nview_init(90,-90)\n', va='top' )
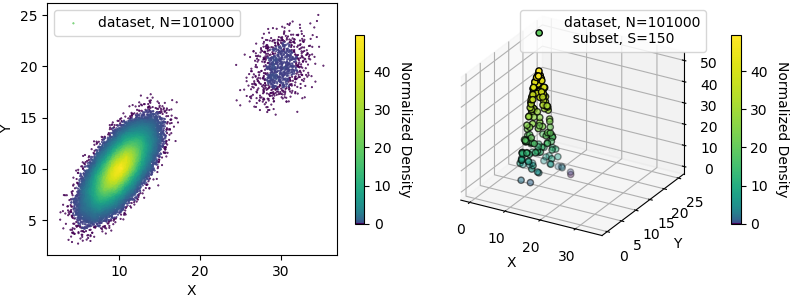
Data points can be individually assigned color using the density function, f, as shown below.

# FIGURE 3 : 2d & 3D plots of data set and sub-set ==============================
# ===============================================================================
vals = f(*data)
fvals = vals/np.amax(vals)  # normalize to range [0,1]
colors = [ cmap(x) for x in fvals ]

subset_data = data[:,:N]
subset_colors = colors[:N]
x,y,z = subset_data[0], subset_data[1], f(*subset_data)  # use density function for Z

label_1 = "dataset, N="+str(len(data[0]))
label_2 = label_1 + "\n  subset, S="+str(len(x))
fig = plt.figure(figsize=(8,3.0))
ax1 = fig.add_subplot(121)
ax2 = fig.add_subplot(122, projection='3d')

ax1.set( xlabel='X', ylabel='Y')
ax2.set( xlabel='X', ylabel='Y')

cbar1 = plt.colorbar(surface.cBar_ScalarMappable, ax=ax1, shrink=0.75 )
cbar1.set_label('Normalized Density', rotation=270, labelpad = 15)
cbar2 = plt.colorbar(surface.cBar_ScalarMappable, ax=ax2, shrink=0.75 )
cbar2.set_label('Normalized Density', rotation=270, labelpad = 15)

ax1.scatter(*data,s=1,marker='.',c=colors,label=label_1)
ax1.legend()

ax2.set_proj_type('ortho')
ax2.scatter(x,y,z,edgecolor='k',c=subset_colors,label=label_2)
ax2.legend()
s3d.auto_scale(ax2,surface)

fig.tight_layout(pad=0)

# ==============================================================================

plt.show()
