
Datagrid and Meshgrid surfaces
This is a comparison between surfaces using a Datagrid or Meshgrid for 3D visualization of data values at xy positions.
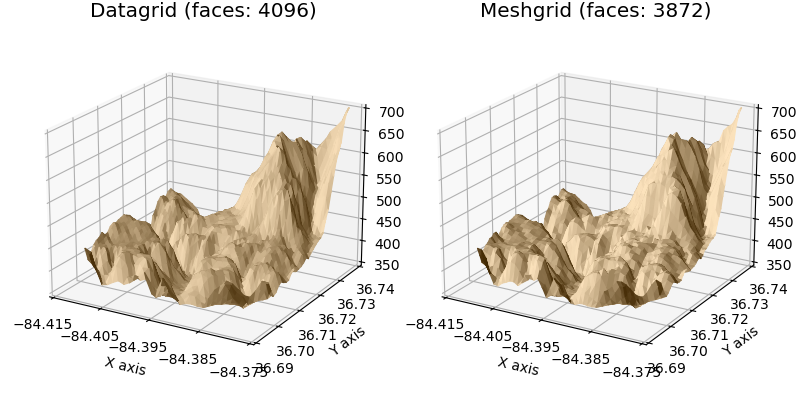
Both surfaces produced by the datagrid and meshgrid methods will produce similar visualizations of the data for surfaces composed of comparably equal number of faces. The only difference being that the datagrid surface will tend to be smoother.
S3Dlib is based on normalized surfaces and, as a result when importing data, the surfaces require coordinate scaling. The method of coordinate scaling is dependent on whether a datagrid or meshgrid is used. These two script constructions exemplify the two methods.
Along with surface smoothing, the advantage of the datagrid method is that the data may be used with mapping an image or mapping geometry on non-planar surfaces.
import numpy as np
import matplotlib.pyplot as plt
from matplotlib.ticker import LinearLocator
import s3dlib.surface as s3d
import s3dlib.cmap_utilities as cmu

#.. Matplotlib Examples: Comparison between Datagrid and Meshgrid surfacs.

# 1. Define function to examine .....................................

with np.load('data/jacksboro_fault_dem.npz') as dem :
    z = dem['elevation']
    nrows, ncols = z.shape
    x = np.linspace(dem['xmin'], dem['xmax'], ncols)
    y = np.linspace(dem['ymin'], dem['ymax'], nrows)
    x, y = np.meshgrid(x, y)

region = np.s_[5:50, 5:50]
x, y, z = x[region], y[region], z[region]

datagrid = np.flip(z,0)

# 2. Setup and map surfaces .........................................
rez=5
ls = s3d.elev_azim_2vector(0,-135)
cmu.rgb_cmap_gradient([0.25,0.15,0], [1,.9,.75], 'cardboard' )

datag_surface = s3d.PlanarSurface(rez,cmap='cardboard')
datag_surface.map_geom_from_datagrid( datagrid )
datag_surface.map_cmap_from_normals(direction=ls)
datag_surface.scale_dataframe(x,y,datagrid)

meshg_surface = s3d.PlanarSurface.meshgrid(x,y,z,True)
sc, rc = meshg_surface.normalize_scale()
meshg_surface.transform(scale=sc)
meshg_surface.map_cmap_from_normals(cmap='cardboard',direction=ls)
meshg_surface.transform(scale=rc)

# 3. Construct figure, add surface, plot ............................

surfaces = [ [datag_surface, 'Datagrid'], [meshg_surface, 'Meshgrid'] ]

fig = plt.figure(figsize=(8,4))
for i in range(2) :
    ax = fig.add_subplot(121+i, projection='3d')
    ax.view_init(20)
    surface = surfaces[i]
    ax.set(xlim=(-84.415,-84.375), ylim=(36.690,36.740), zlim=(350,700) )
    ax.xaxis.set_major_locator(LinearLocator(5))
    ax.yaxis.set_major_locator(LinearLocator(6))
    ax.zaxis.set_major_locator(LinearLocator(8))
    ax.set_xlabel('X axis')
    ax.set_ylabel('Y axis')
    nfaces = ' (faces: '+str(len(surface[0].fvIndices))+')'
    ax.set_title(surface[1]+nfaces, fontsize='x-large')

    ax.add_collection3d(surface[0])

fig.tight_layout()
plt.show()
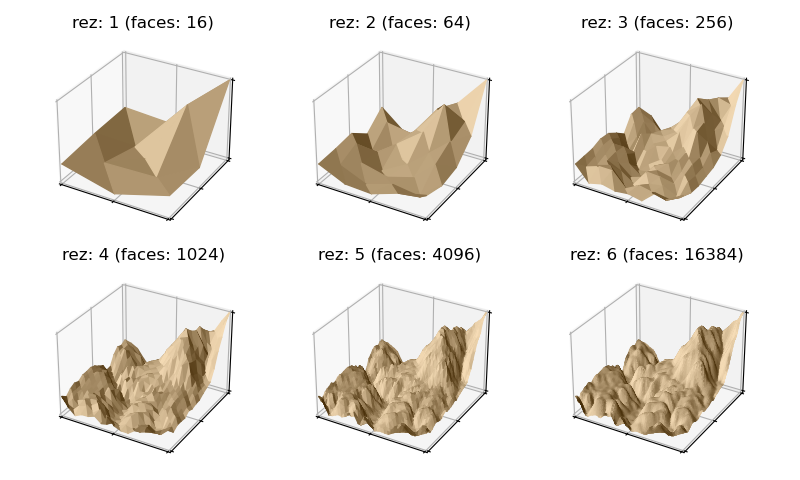
Datagrid construction will smooth the surface as the surface resolution approaches the resolution of the original data. Continued increases in resolution will further smooth out the surface but still preserved the overall surface shape set by the data.
import numpy as np
import matplotlib.pyplot as plt
import s3dlib.surface as s3d
import s3dlib.cmap_utilities as cmu

#.. Matplotlib Examples: Datagrid Resolution

# 1. Define function to examine .....................................

z=np.load('data/jacksboro_fault_dem.npz')['elevation']
datagrid = np.flip( z[5:50, 5:50], 0 )

# 2 & 3. Setup surfaces and plot ....................................
cmu.rgb_cmap_gradient([0.25,0.15,0],[1,.9,.75],'cardboard')
ls = s3d.elev_azim_2vector(0,-135)

fig = plt.figure(figsize=plt.figaspect(0.6))

for i in range(1,7) :
    ax = fig.add_subplot(2,3,i, projection='3d')
    ax.set(xlim=(-1,1), ylim=(-1,1), zlim=(0,1) )
    surface = s3d.PlanarSurface(i,cmap='cardboard')
    surface.map_geom_from_datagrid( datagrid )
    surface.map_cmap_from_normals(direction=ls)
    nfaces = ' (faces: '+str(len(surface.fvIndices))+')'
    ax.set_title('rez: '+str(i)+nfaces)
    ax.set_xticks([-1,0,1])
    ax.set_yticks([-1,0,1])
    ax.set_zticks([0,1])
    ax.tick_params(labelcolor='w')

    ax.add_collection3d(surface)

fig.tight_layout()
plt.show()