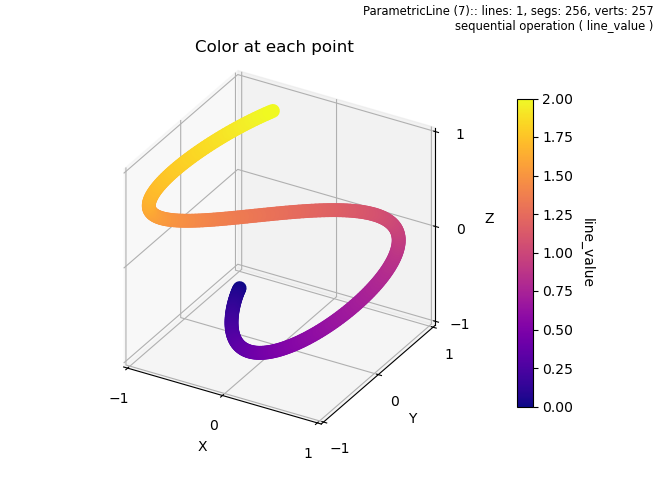
Multicolored line
This is a comparison to the Multicolored lines Matplotlib example.

import numpy as np
from matplotlib import pyplot as plt
import s3dlib.surface as s3d

#.. Matplotlib Multicolored lines

# 1. Define function to examine .....................................

def line_value(t) :
    return 2*t        #   0 <= t <= 1

def colored_line(t) :
    a,b = -7.4, -.5
    T = (b-a)*t + a   #   0 <= t <= 1
    x = 0.9 * np.sin(T)
    y = 0.9 * np.cos(1.6 * T)
    z = 2*t - 1  # include a z coordinate [-1,1]
    return x,y,z

# 2. Setup and map line .............................................
rez = 7

line = s3d.ParametricLine(rez,colored_line,lw=10)
line.map_cmap_from_sequence('plasma',line_value)

# 3. Construct figure, add line, and plot ...........................

minmax, ticks = (-1,1), [-1,0,1]
fig = plt.figure(figsize=(6.6,5))
linelabel = str(line)+'\n'+ 'sequential operation ( '+line.cname+' )'
fig.text(0.99,0.99,linelabel, ha='right', va='top', fontsize='smaller')
ax = plt.axes(projection='3d',facecolor='w', aspect='equal', proj_type='ortho')
ax.set(xlim=minmax, ylim=minmax, zlim=minmax,
    xlabel='X', ylabel='Y', zlabel='Z',
    xticks=ticks, yticks=ticks, zticks=ticks )
ax.set_title("Color at each point")
cbar = plt.colorbar(line.cBar_ScalarMappable, ax=ax,  shrink=0.8, pad=.1 )
cbar.set_label(line.cname, rotation=270, labelpad = 15)

ax.add_collection3d(line)

plt.show()
